Use your product data to drive expansion revenue | Census
Sylvain GiulianiSeptember 01, 2022
Syl is the Head of Growth & Operations at Census. He's a revenue leader and mentor with a decade of experience building go-to-market strategies for developer tools. San Francisco, California, United States
This is part two of our Product Data to Revenue series, exploring how you can turn your product data into more revenue. In each part of this series, we're revealing actionable tactics to help you generate more revenue by leveraging your existing product usage data.
We all want to drive more expansion revenue, but perhaps we don’t realize just how important it is to drive growth. In a study analyzing the revenue of 5000+ SaaS companies, the fastest growing companies are seeing at least 20% of sales revenue come from expansion, and some high-growth companies are seeing as much as 40% of sales that can be attributed to expansion revenue.
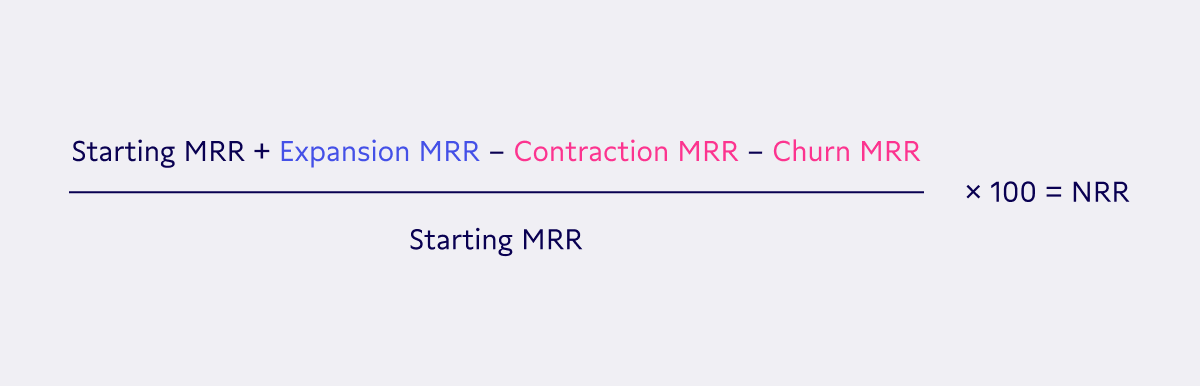
With all the economic ups and downs, SaaS businesses are rethinking their approaches to growth. They’re shifting focus to sustainable means to increase revenue, like net revenue retention (NRR) which measures the growth rate of existing customer revenue by factoring in expansion revenue, downgrades, and churn.
Using this simple calculation, you can calculate an accurate NRR.
The most successful SaaS companies to IPO recently have NRR rates well over 120%:
This means that even if they don’t add new customers this year, they’ll still grow at least 20% of their revenue in the next.
To improve your NRR, you have two options: Either reduce churn or promote expansion revenue. In this post, we’re focusing on 80-20 use cases to drive more expansion revenue using your product data (and we’ll tackle reducing churn in our next post).
Product usage data isn’t just for your Product team
Generating new revenue from your existing customers means understanding exactly how they’re using the product. Although having product analytics is table stakes for a SaaS company, too often, that data gets stuck with the Product team or lies unused in a dashboard graveyard. Instead, your product data needs to be in the hands of your Sales, Marketing, and Customer Success teams – those on the frontline of driving revenue for the business.
Below, we’ve gathered use cases and examples of how GTM teams at some of the best product-led growth (PLG) companies are leveraging their product data to drive more expansion revenue. Although these companies are “pure-play” PLG companies, we’ve generalized these tactics so even a more sales-led company can implement them.
#1 Use product-qualified lead scoring to automatically route upsell opportunities with the most potential
Product Qualified Leads (PQLs) are potential customers who have already had a positive interaction with your software. They’re users of your freemium version or free trial users who have achieved a specific set of qualifying actions designed to identify users who are most likely to buy or upsell.
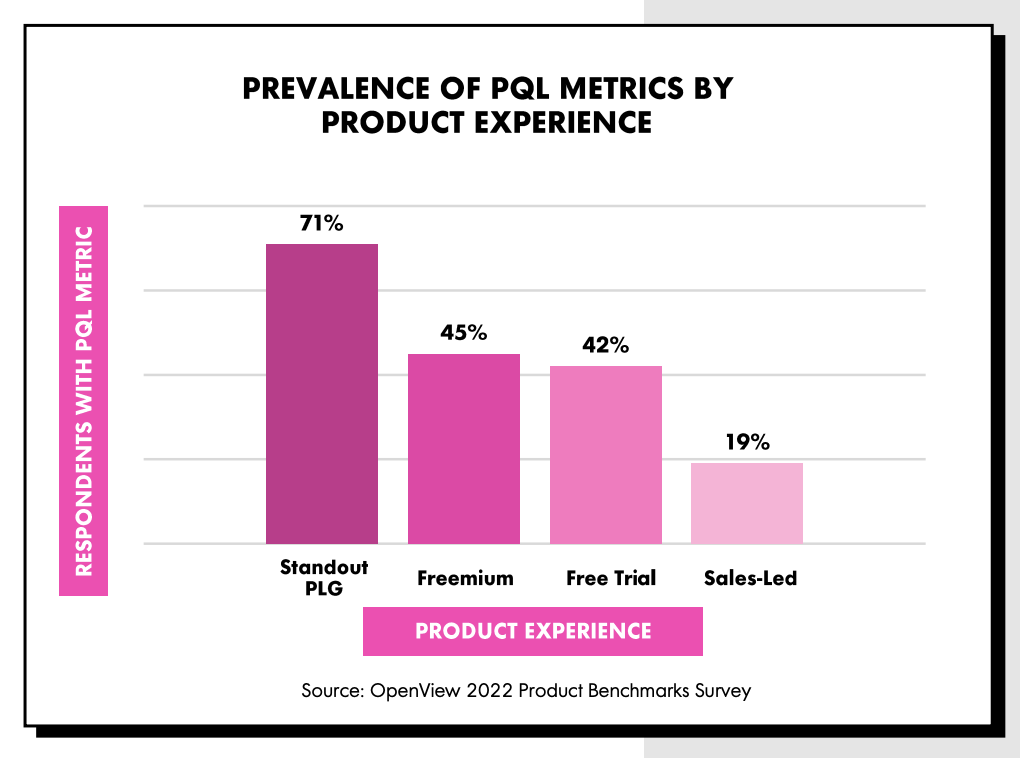
PQLs convert at a higher rate (5x to 6x that of MQLs) and are less likely to churn once they’ve become paying customers. Despite this, most companies today are still not leveraging PQLs – with only45% of freemium companies and 19% of sales-led companies using them.
The majority of standout PLG companies, on the other hand, do have a PQL metric.
PQLs for expansion revenue: Finding the lead needle in the haystack opportunity
For companies with a freemium or free trial product, the sales team often struggles to identify or prioritize leads for upsell opportunities amongst a large volume of sign-ups.
Take this example: A handful of people from a company are using your product in a completely self-serve way, with no interaction with the sales team. However, there could be an opportunity to upsell a higher plan to the Admin, who might be interested in better access controls.
In this case, you could simply wait for the customer to raise their hand that they are ready for an upsell (and from the data above, most companies are still doing this) or you could proactively identify PQLs who would be best suited to an upsell and route them to your reps at the right time.
To do this, you need to create a PQL scoring model, so you can filter PQLs according to certain criteria.
PQL scoring factors in select product usage criteria into your lead score
Just like regular lead scoring, PQL scoring is all about combining buying signals from the customer. The main difference is that you incorporate select product usage metrics into the score. Figuring out what types of product usage correlates with what buying signals for your company might take some time and iteration, but two places to start are:
Looking at the product usage metrics you most often report on (things like number of active users, number of shares, or adoption of enterprise features such as SSO)
Looking for patterns in your best-fit converted customers
Here are some generic examples of product usage metrics from different categories that might be used in a PQL score:
Messaging tool: An account sends 2000 messages
eSignature tool: 3 documents signed per month
Design tool: Number of users added to the team
Let's take a look at how a standout PLG company like Figma uses PQLs to increase its expansion revenue.
Figma: Using PQLs to make their sales team 10x more productive
Figma is a collaborative design tool whose freemium model showed huge success amongst users when it launched in 2016. To capitalize on that growth, they launched an “Organizations” product and decided to build an Enterprise Sales team to drive its adoption. Their new sales team faced two main challenges:
With millions of users worldwide, their sales team struggled to prioritize the right leads for the new Organizations product
Their CRM (Salesforce) wasn’t structured with an “account” view of the world. They had several teams using their product from within the same company, and the enterprise rep needed to have the full picture of that account’s usage when attempting to upsell
How they solved these problems:
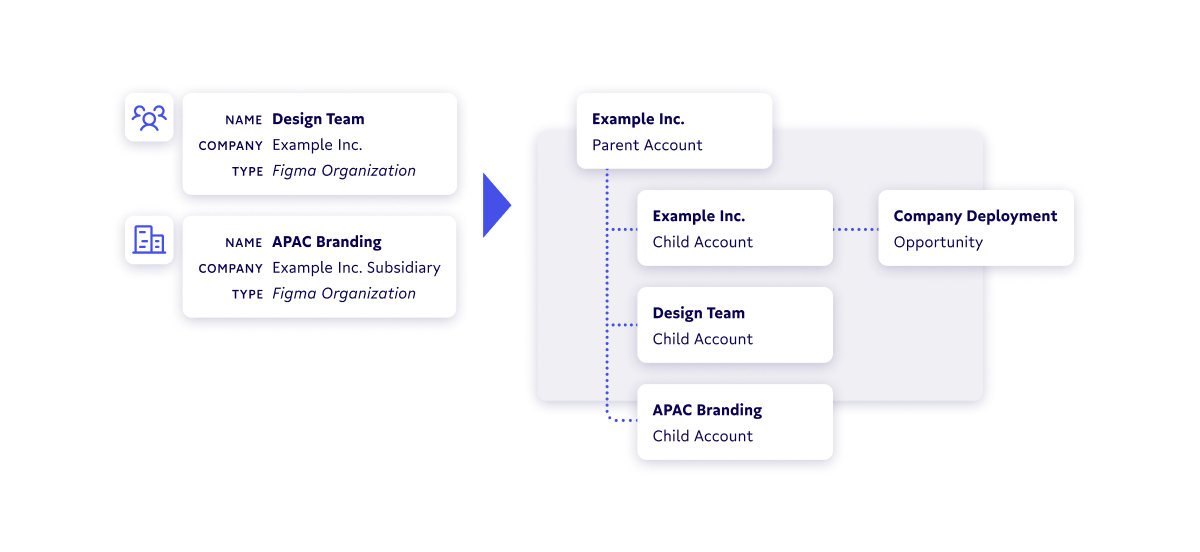
Built a Unified Account Hierarchy model in their data warehouse to give a 360° view of an organization to the Account Exec and synced that to all their GTM tools. With a full view of an organization at their disposal, their AEs were able to have far more productive discovery calls.
Identified and routed freemium users with a PQL scoring model that incorporated Figma’s “ICP with high revenue potential” to the enterprise sales team. Once they had an idea of what accounts to target, they were able to focus on the right leads.
Highlight leads for your sales team to focus on with a unified account view.
Read more on Figma’s story here. If you want to learn more about PQLs and how to implement a PQL scoring model, you should check out this post on PQLs.
#2 Automate usage alerts to account owners to drive more proactive upsell conversations
If your customer is hitting a limit or threshold within your product, that’s an obvious sign that they are ready for an upsell. But rather than have the customer feel frustrated by hitting a limitation, you can set up product usage alerts that enable you to proactively reach out to customers before they hit limits (and kick off an upsell conversation early).
Who doesn’t hate hitting these feature gates?
While PQLs might only trigger once a customer has hit certain criteria checkpoints across several buying signals, it’s a good idea to set up a few important product and feature usage metrics in your CRM for your reps. This way, they get the full context of a customer at a glance.
Keep in mind that changes in product usage can be both positive and negative. A positive change in usage in the past week could mean that trial is progressing well, while a significant drop in usage in the past 30 days could signal an at-risk account. It’s especially useful for reps to be able to see this delta (change in usage) over time for a particular account.
Here are some examples of when to use feature usage alerts:
To help reps understand trial or POC progress and unblock their accounts by identifying “trial milestones”
To identify upsell opportunities based on feature usage thresholds (e.g. adding 4 members to a team when the plan limit is 5)
To identify at-risk accounts when usage drops below a certain threshold (e.g. 2 admins have been removed from the platform)
Now, you’re uncovering sales opportunities that are actually beneficial to users – which was particularly effective for a developer-focused tool like Docker.
Docker: Driving more authentic upsell conversations
Docker is a development environment platform with millions of active developers. As part of their freemium model, developers can upgrade to support larger-scale applications and access advanced features like parallel builds and granular access control.
With millions of users each month, teams at Docker deal with a lot of data. Not only does Docker have data from well over 10 million users, but there’s also a wealth of marketing and developer relations activity generating engagement data across a variety of channels. So, Docker’s revenue team collaborated with their data team to build a single source of truth for each of their customers inside the data warehouse and sync that to their CRM. Now, instead of trying to sell every user a solution that might not make sense for their use case, their sales team was able to lay out a plan to approach the right customers.
Take this flow, for example:
Several developers from the company ACME are collaborating using Docker
Their product usage data is piped into the data warehouse and transformed/cleaned to build a customer 360 model. For Docker, that means joining various datasets on product usage behavior, marketing behavior, and event attendance
This data appears in Salesforce so sales and CS teams can have 360-at-a-glance context on how ACME is using Docker
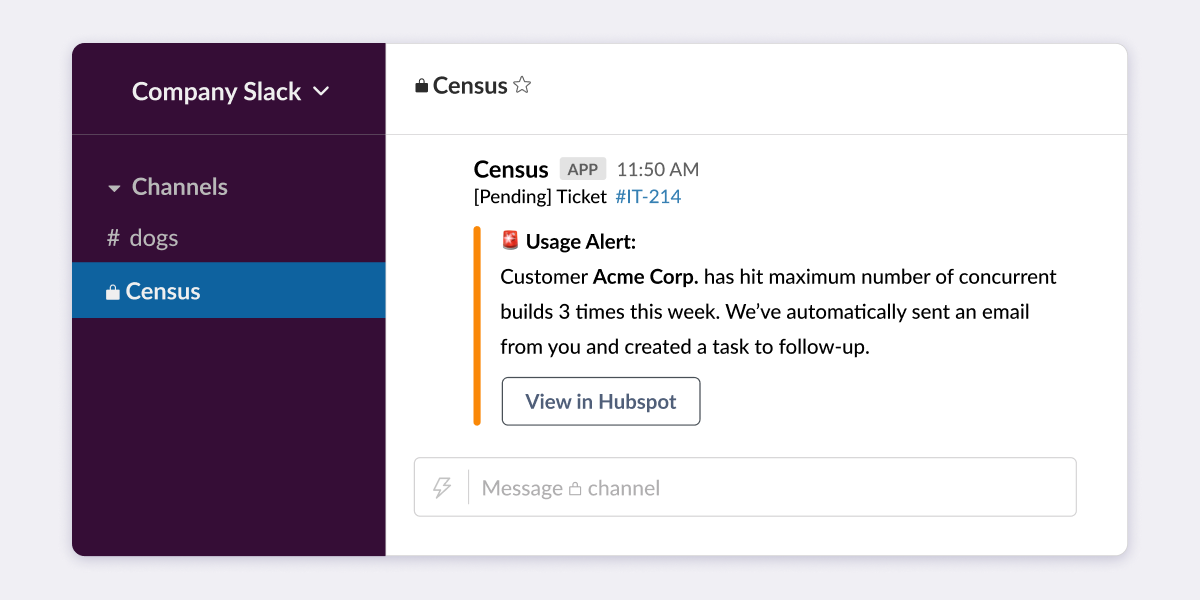
The sales team sees that one of the teams at ACME is frequently hitting its maximum number of concurrent builds (one of its key tracked product metrics), slowing ACME’s development team down.
By linking this data to their CRM, an automated alert is sent to the account owner, alerting them of the usage. The AE can now reach out to the team at ACME proactively and offer value, asking, “I noticed X was happening, and I was wondering if you wanted to talk about increasing the speed of your builds.”
The sales conversation can now revolve around the customer’s real, demonstrated needs resulting in both a happier customer and a happier sales rep.
Automated alerts allows sales teams to stay on top of upsell opportunities
#3 Deliver personalized marketing communications at the right time to prime customers for upsell
Instead of only using product data to help your sales and customer success teams personalize their conversations with customers, you should use a one-two punch tactic. By also leveraging this data to personalize your marketing communications with customers, you can educate them on relevant use cases and even automate feature suggestions.
To identify what features might be right for customers, you can tap into both first- and third-party data sources such as:
Clearbit tool enrichment data
Website visits to relevant product pages or docs pages
Product use case blog posts visits
In-app data like visits to feature-gated pages
Crossbeam’s technology partner overlap data
Once you’ve identified these feature signals by combining your first- and third-party data, you can leverage them to:
Trigger personalized emails or in-app messages educating customers on particular features at the right time (i.e., suggesting a relevant integration)
Automate a nurture sequence or email marketing newsletter sharing content relevant to the product feature, so you can proactively educate customers on use cases to prime them before upselling
Let’s take a look at examples of these use cases from Crossbeam and Canva.
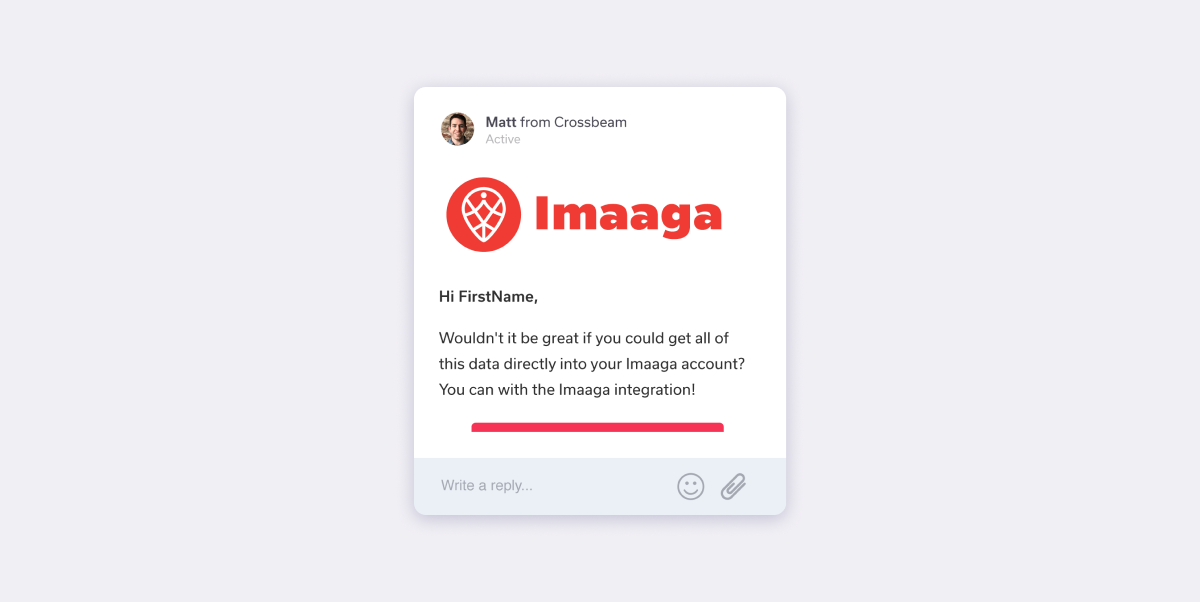
Crossbeam: Automating integration upsells
Crossbeam is a partner ecosystem platform that has found interesting ways to leverage partner data to drive upsells. One example that’s relevant to almost any SaaS company is how they’re using data to drive product integration adoption.
By using Crossbeam overlap data, they can identify what other products their customers are using and then leverage this data by:
Adding suggested integrations to a field in their CRM so their sales team can have more personalized conversations with customers
Triggering personalized automated messaging (both email and in-app) to suggest relevant integrations
Of course, they are leveraging Crossbeam partner data to power this, but you could leverage any of the data sources listed above (e.g. docs page visits) to be able to suggest integrations to customers.
Canva: Personalizing product marketing for 55M users
Canva (an online design tool) has been a huge PLG success story, with over 55 million users around the world. As you can imagine, Canva’s users generate A LOT of data on their actions in the product regarding what templates they use, what features they use, etc. All of these actions provide a lot of meaty data for Canva to use to personalize their messaging to users.
Canva uses their data warehouse as a single source of truth for analysis and then uses Census to push their data to Braze so that they can:
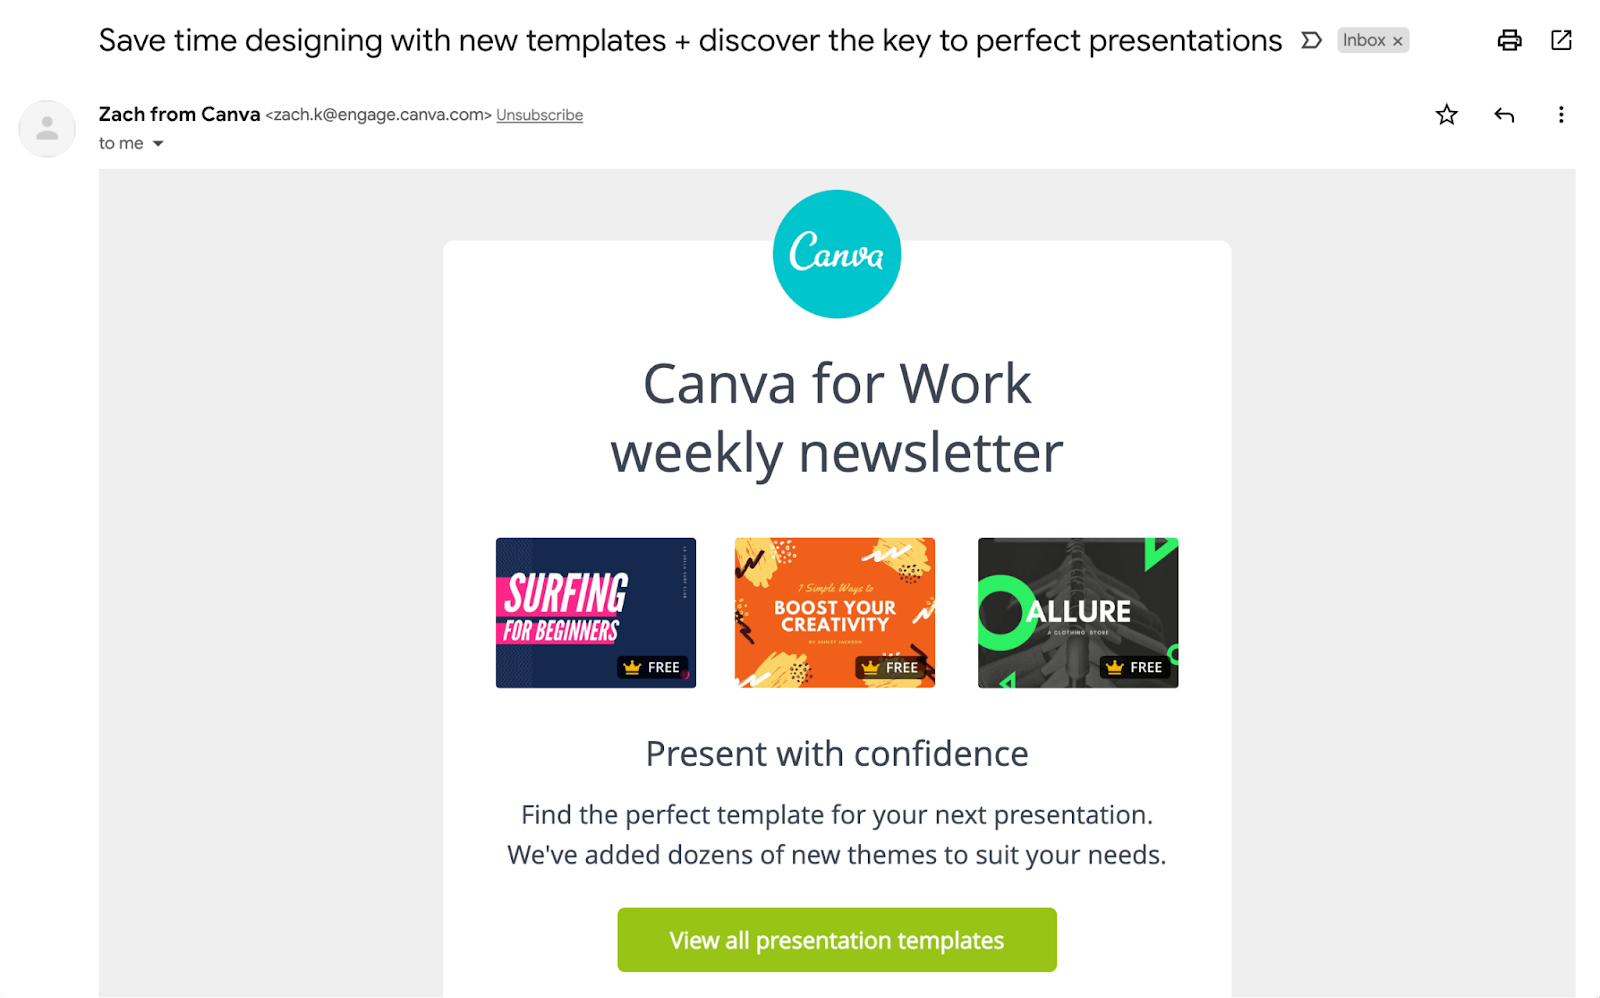
Send personalized product marketing messages to millions of users at scale. For example, hard-core “presentations” users receive targeted emails on presentations.
Create dynamic audiences based on product usage to send those marketing messages to
A great place to start looking for which features to build personalized messaging on would be to look at the feature breakpoints of your pricing plans since you’re likely already tracking these metrics.
Example of a personalized newsletter from Canva on their presentations feature
Drive more value for your customers across sales and marketing
The goal of using your product data to drive expansion revenue isn’t to trap your customer or cheat them into more revenue; it’s to have more authentic conversations with your customer.
Ultimately, though, all these use cases are vehicles to help you stretch your existing resources, do more with less, and turn your product usage data – that’s data that you already have – into more expansion revenue.
How do you get started putting customer data into your GTM tools?
If these use cases have piqued your interest, you might be wondering how to get started accessing your customer data. At Census, we help companies of all sizes sync customer data from their warehouse to their business tools to get their valuable user insights where and when they need them.
Book a free consult, and we’ll talk through ideas on how you can leverage your existing product and customer data to automate your expansion revenue.