


Since the debut of dashboards, there have been broken dashboards – something every data engineer laments. 😩
But neither the modern data platform nor the use cases it powers are as simple as they used to be, so what started as minor inconveniences, or perhaps the occasional email from an annoyed employee in the marketing department, have mutated into serious business disruptions (and a glaring spotlight from the C-suite). 🔦
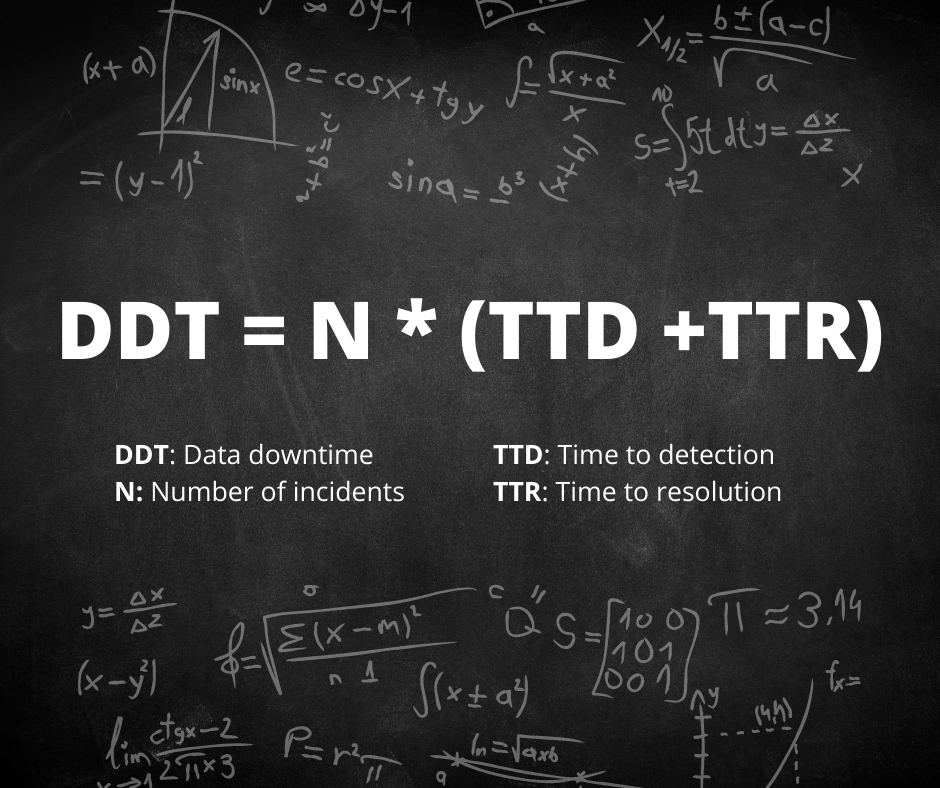
Monte Carlo coined the term “data downtime” to refer to this terrifying period of time when your data is partial, erroneous, missing, or otherwise inaccurate.
The incredibly complex and multifaceted nature of modern data operations virtually necessitates that every organization suffers some period of data downtime. Unfortunately, while it's a quantifiable metric with an impact that can be measured and optimized, downtime is typically addressed in a reactive (costly) manner. 💰
Progressive data teams that have (wisely) implemented reverse ETL have made their data more visible, actionable, and valuable. However, when you make your data more valuable, you also make any data downtime more costly – and when you make your data more visible, bad data erodes trust more quickly.
In this post, you'll learn:
- What data observability is
- How data observability reduces data downtime
- How data observability is different than testing or monitoring
- Why data observability and reverse ETL are better together.
What is data observability?
Data observability is an organization’s ability to fully understand the health of the data across the entire system. Like its DevOps counterpart, data observability uses automated monitoring, alerting, and triaging to identify and evaluate data quality and discoverability issues.
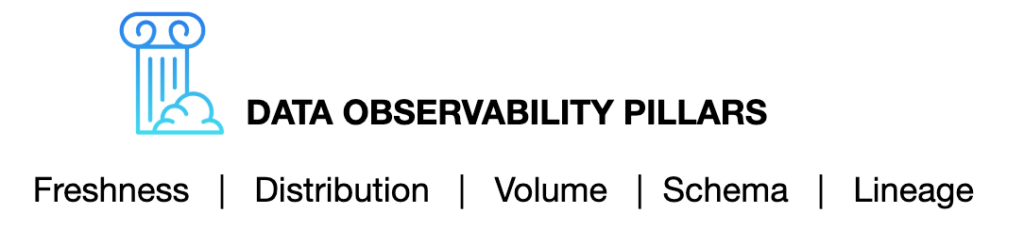
We’ve broken data observability into five pillars: freshness, distribution, volume, schema, and lineage. These components meld together to provide valuable insight into the quality and reliability of your data. 🤝
- Freshness: Is the data recent? When was the last time it was generated?
- Distribution: Is the data within accepted ranges?
- Volume: Has all the expected data arrived?
- Schema: What is the schema, and how has it changed? Who has made these changes and for what reasons?
- Lineage: Where did my data break? Which tables or reports were affected
How data observability reduces data downtime
Data observability solutions connect to your existing stack without having to modify pipelines or write new code. They can monitor data at rest (without having to extract it from where it's stored) with no prior mapping and, by properly leveraging machine learning, with minimal configuration.
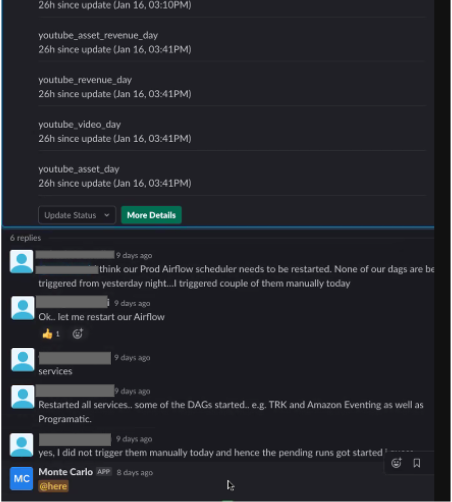
With proactive monitoring and alerting in place, data issue detection time is drastically reduced. Issues that might have previously taken teams hours, days or even weeks (‼️) to notice are caught and sent to teams in Slack (or another communication tool) within minutes. ⏱️
Shortening the time to detection also naturally shortens the time to resolution, as Choozle Chief Technical Officer Adam Woods explains when discussing how his team reduced data downtime by 88%.
“We see about 2 to 3 real incidents every week of varying severity. Those issues are resolved in an hour whereas before it might take a full day,” said Adam. “When you are alerted closer to the time of the breakage, it’s a quicker cognitive jump to understand what has changed in the environment.”
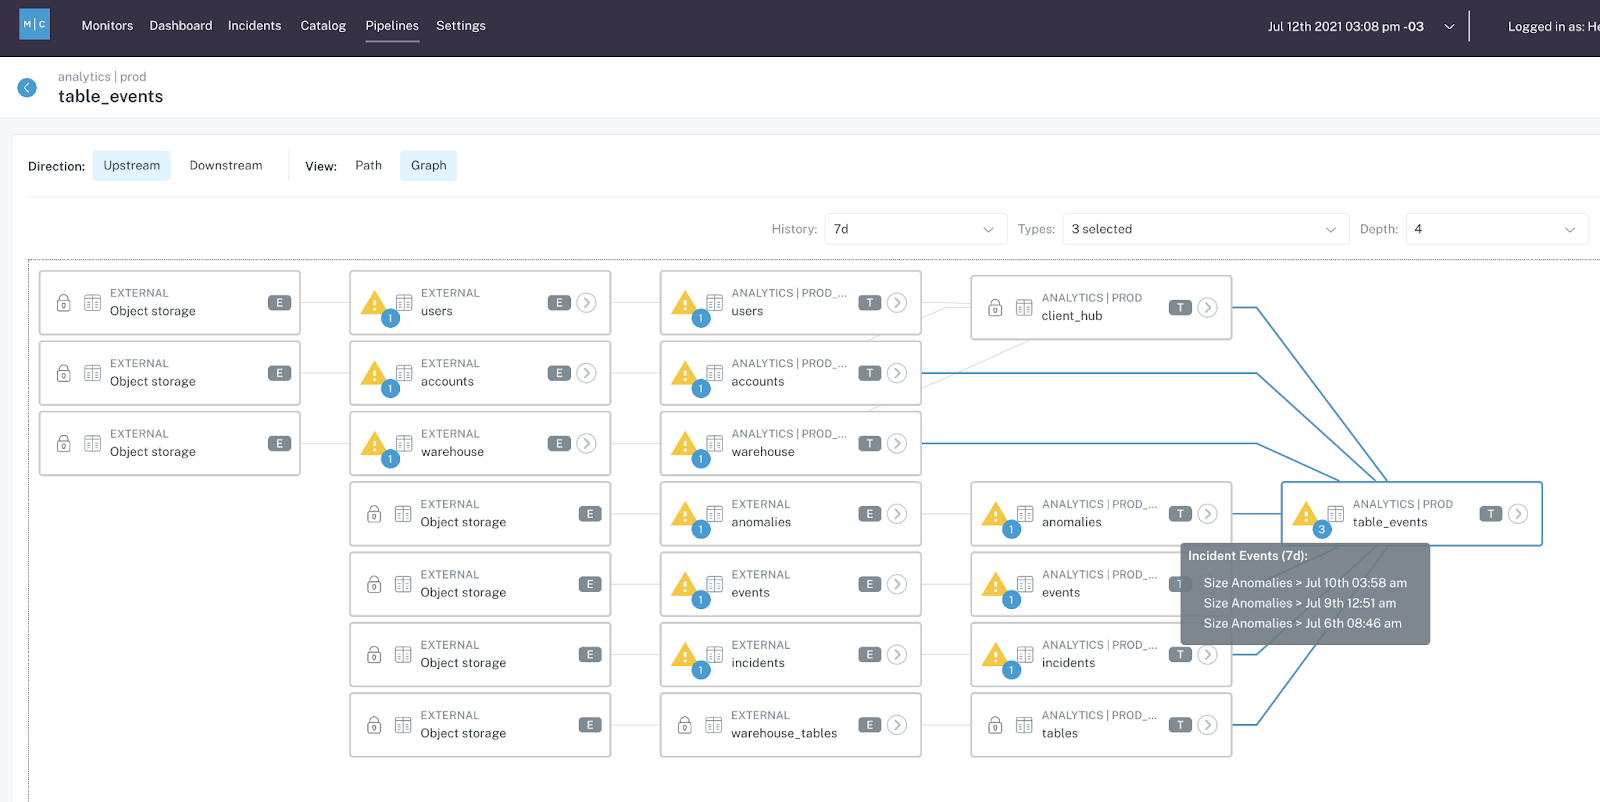
Data observability also shortens the time to resolution with end-to-end lineage, which monitors data assets and pipelines along the entire data lifecycle and is often used alongside reverse ETL change logs and live debuggers. This pinpoints where the breakage has occurred and greatly accelerates root cause analysis.
So, data observability solutions can reduce time to detection and resolution with active monitoring, rapid triage, and end-to-end lineage, but what about reducing the number of data quality issues in the first place? 🤔
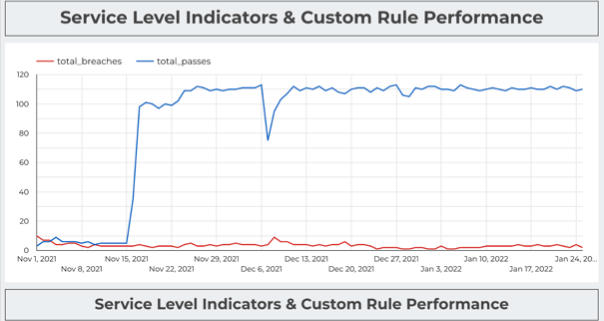
This is where data health analytics come into play. After all, you can only improve what you can measure. Red Ventures Senior Data Scientist Brandon Beidel leverages data observability to set and track data SLAs. In his words:
“The next layer is measuring performance. How well are the systems performing? If there are tons of issues, then maybe we aren’t building our system in an effective way. Or, it could tell us where to optimize our time and resources. Maybe 6 of our 7 warehouses are running smoothly, so let’s take a closer look at the one that isn’t.”
Data observability tools can also be used to tag and certify tables, letting data analysts know which are good to leverage for their reports rather than having to choose between risking pulling an out-of-date table or pinging a data engineer for the fifth time that day.
How data observability is different than testing or monitoring
Similar to how software engineers use unit tests to identify buggy code before it's pushed to production, data engineers often leverage tests to detect and prevent potential data quality issues from moving further downstream. This approach was (mostly) fine until companies began ingesting so much data that a single point of failure just wasn’t feasible.
I’ve encountered countless data teams that suffer consistent data quality issues despite a rigorous testing regime. It’s deflating – and a bad use of your engineers’ time.
The reason even the best testing processes are insufficient is because there are two types of data quality issues: those you can predict (known unknowns) and those you can’t (unknown unknowns).
Some teams will have hundreds of tests in place to cover most known unknowns but they don’t have an effective way to cover unknown unknowns. Some examples of these unknown unknowns covered by data observability include:
- A Looker dashboard or report that is not updating, and the stale data goes unnoticed for several months—until a business executive goes to access it at the end of the quarter and notices the data is wrong.
- A small change to your organization’s codebase that causes an API to stop collecting data that powers a critical field in your Tableau dashboard.
- An accidental change to your JSON schema that turns 50,000 rows into 500,000 overnight.
- An unintended change happens to your ETL, ELT, or reverse ETL that causes some tests not to run, leading to data quality issues that go unnoticed for a few days.
- A test that has been a part of your pipelines for years but has not been updated recently to reflect the current business logic.
In a Medium article, Vimeo Senior Data Engineer Gilboa Reif describes how using data observability and dimension monitors at scale helps address the unknown unknowns gap that open source and transformation tools leave open. “For example, if the null percentage on a certain column is anomalous, this might be a proxy of a deeper issue that is more difficult to anticipate and test.”
Choozle CTO Adam Woods says data observability gives his team a deeper insight than manual testing or monitoring could provide. “Without a [data observability tool], we might have monitoring coverage on final resulting tables, but that can hide a lot of issues. You might not see something pertaining to a small fraction of the tens of thousands of campaigns in that table, but the [customer] running that campaign is going to see it. With [data observability] we are at a level where we don’t have to compromise. We can have alerting on all of our 3,500 tables.”
In short, data observability is different and often more comprehensive than testing because it provides end-to-end coverage, is scalable, and has a lineage that helps with impact analysis. If that's not enough, it's more proactive than monitoring because it takes the next step with incident triage and impact analysis.
Why data observability and reverse ETL are better together
The two components of risk are the likelihood of an event and its severity.
The promise of reverse ETL is to make data more actionable, within the tools and systems leveraged by different organizational departments in the day-to-day workflows.
In some cases, the data may be used as part of sophisticated automation. For example, offering a coupon to website visitors with a profile that indicates they are less likely to purchase. These use cases often surface product information to inform operations teams at Product-Led companies, a concept known as Operational Analytics.
Because these use cases hold tremendous value to the company, the prospect of data downtime becomes a more severe event. This holds true as data directly informs and fuels external-facing processes as well. It would completely change the tone of a customer interaction if their usage were only half of what the CRM/CS tool says.
Can you imagine if companies operated with the same reactive, ad-hoc attitudes toward their website or product reliability that many data teams still do regarding their data quality? 😬
The likelihood of data downtime has also increased alongside the volume of data and the increasingly complex underlying infrastructure. Simply put, more data and more moving parts increase the chances something goes awry.
I want to be clear that the benefits of reverse ETL far outweigh any potential risk. Let’s face it: Data is at its best when it is unchained from dashboards and actionable – and it’s also at its best when it can be trusted.
Just like modern braking systems actually allowed cars to operate at higher speeds, data observability can do the same for data teams. To foster a culture of innovation and data-driven excellence, teams need to move boldly knowing they will be the first to know of any issues.
As we embark on an exciting journey to elevate data from the back-office to optimize business processes, let’s also be sure our next step is to proportionally elevate our approach to data quality through data observability.
Interested in getting started with data observability? Reach out to the Monte Carlo team. Have thoughts on how data observability pairs with reverse ETL? Share them in The Operational Analytics Club. ✨