


If you’re involved in the data community, it’s almost impossible to read messages or blog posts that neglect mentioning dbt labs – especially amongst the analytics engineering crowd. And, if you’re anything like me, you probably started by Googling “dbt” only to find Dialectical Behavior Therapy (DBT) pop up, making you wonder what the heck this has to do with data. 🤔 But don’t get them confused: The data tool known as dbt is all lowercase (and has nothing to do with therapy). 😂
In this article, we’ll get to the bottom of the data build tool known as dbt. No more nodding your head, pretending you understand the difference between a data warehouse and a data model. After this, you’ll fully understand each of their purposes, how they work together, and how they relate to dbt!
Better yet, you’ll walk away with an understanding of the impact dbt has on your business unit and how it makes your job easier. 💯
Let’s start with the basics
Data warehouse
In order to understand the purpose of dbt, we need to start with the fundamentals – like what it is. So, at a basic level, dbt is a modern data stack tool.
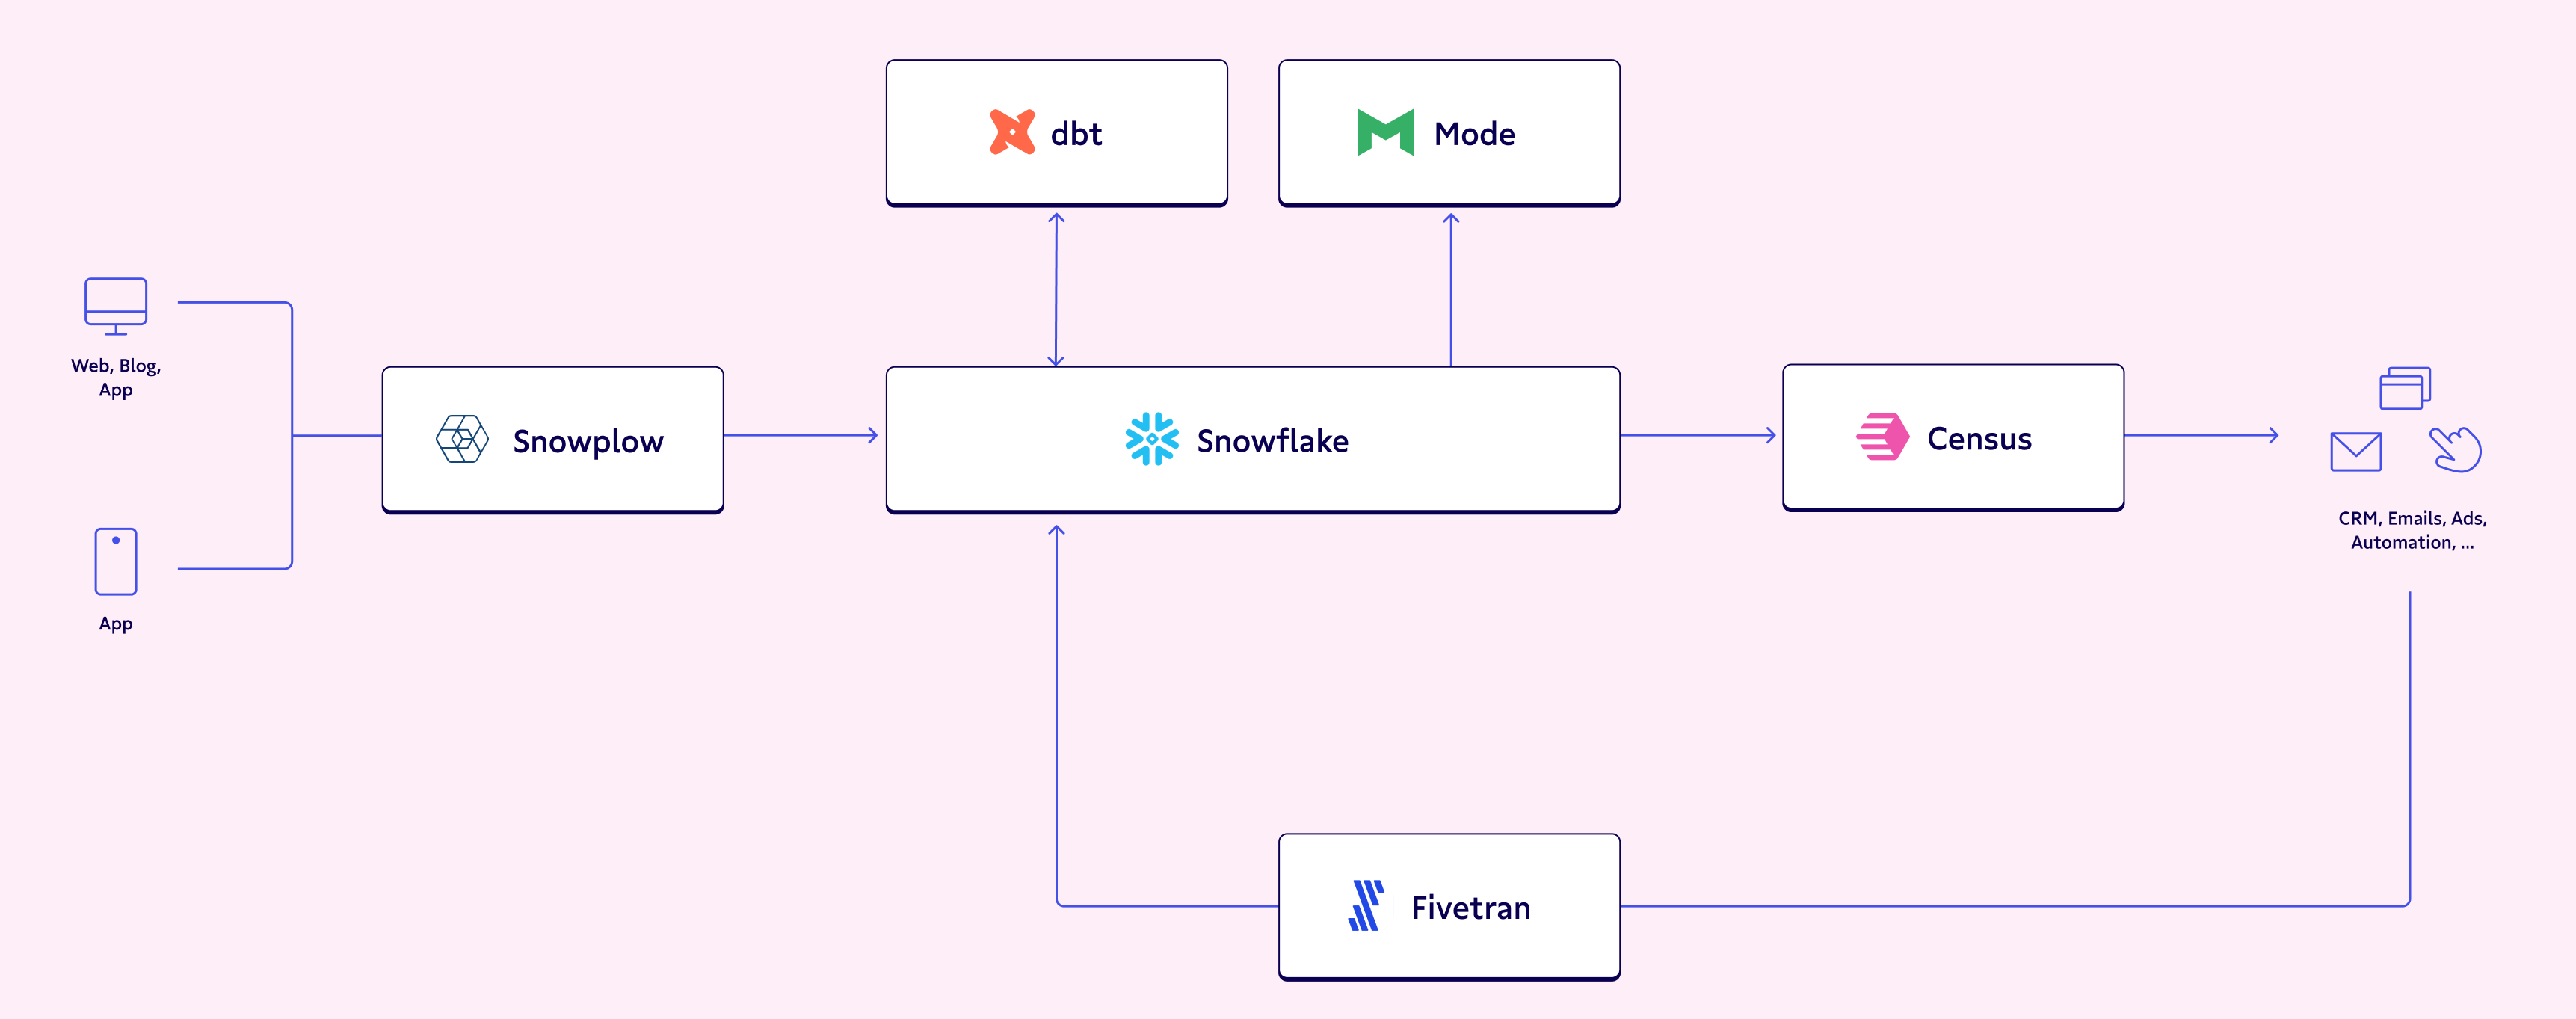
A modern data stack (MDS) consists of a few different components centered around a data warehouse that acts as the central storage unit for all your business’s data – clean and unclean alike. Simply put, the data warehouse is your knowledge and decision-making hub, acting as the brain of your organization.
Alternatively, for our foodie folks (✋), you can think of a data warehouse as a kitchen: It stores all of the ingredients needed to make a meal, acts as the hub for the prep and cooking of the meal, and, yes, even stores the finished meal itself.
SQL
SQL is the universal coding language that is used to access all of the powerful data within the data warehouse. It’s used to select, aggregate, and join different pieces of data.
Let’s make it more relatable: You can think of SQL as the hands and tools that make the meal. Without a spatula or mixing spoon, you would just have a bunch of raw ingredients that you can’t do much with. With some simple kitchen tools, though, you can combine all your ingredients to concoct a delicious, hearty meal. 🥣
Similarly, without SQL, you can’t draw much insight from the raw data that sits within the data warehouse – but when you incorporate SQL, you can derive actionable insights to empower your decisions.
Data model
A data model is essentially many SQL queries strung together to produce a dataset that helps standardize KPIs across all areas of the business. They contain calculations that may need to be done repeatedly throughout the business, thereby ensuring they are done the same way each time. With the help of automatic and continual updates, the most recent calculations are always available.
In our kitchen metaphor, you can think of a data model like a recipe book that contains the logic to make a meal. It isn’t the meal itself (or even any of the ingredients used to make the meal), but a set of instructions that need to be executed in order to make your ingredients into a meal. In this case, a meal would be a dataset that would be stored in your kitchen (data warehouse) when it is completed.
dbt makes creating these data models a little easier. It utilizes SQL to help you organize different parts of your code so that you don’t need to repeat logic throughout multiple different data models.
TLDR; dbt models are just tool that help you compile different SQL files and run them in an optimized way. Basically, if you can write SQL, you can easily use dbt! Let’s dive deeper into this. 🤿
Ready to talk about dbt?
Now, back to our cooking analogy: dbt is a tool for creating cookbooks. It helps you stay organized, stores your recipes by category, references other recipes within other recipes, and includes tips and techniques to make your meals better along the way. You can count on dbt to keep your SQL files organized, enabling you to maintain a clean coding environment for all your data transformations. 🧼
SQL, on the other hand, is all about how you execute the recipe. It’s the hands, spoons, and spatulas that allow you to combine all the ingredients into a meal.
Because dbt only uses SQL, it can be easily learned and used by anyone – which is exactly why it’s so widely used (and loved). It’s built off a basic data skill that almost every data analyst, data engineer, data scientist, and analytics engineer knows, making the learning curve so small anyone can seamlessly implement it in their modern data stack.
Have you ever noticed how a cookbook has a specific section dedicated just to recipes for sauces? And then how these sauce recipes are referenced throughout the cookbook?
Instead of repeating the recipe for each in a bunch of different recipes, they are consolidated in their own section and then later referenced. This is similar to how dbt operates. If you have one piece of SQL code that you use in many different data models, instead of writing it in every data model, you can write it once and then use the dbt cloud to reference it in each model.
How? dbt allows you to write multiple SQL queries for each of your data models and then compiles them to run together as if they were one single query. As a result, you can reuse code without rewriting it, saving you both computing power and time. Just as a cookbook re-references recipes in order to save pages and make the glossary easy to follow, dbt organizes SQL files in a way that allows the engineer to re-use and execute code.
How dbt interacts with the data warehouse
Dbt actually runs within your data warehouse, compiling the SQL files to run against the data that is stored in your data warehouse. Your stored data can be referenced and transformed into new datasets – all while never leaving your warehouse.
Again, think of the data warehouse as your kitchen. You cook your meals in the kitchen, use your utensils and tools within the kitchen, you do every part of your meal prep in your kitchen. Just like you wouldn’t cook your dinner in your bathroom, you won’t be running dbt anywhere besides your data warehouse.
How dbt code is stored
You may have also heard terms like S3 and Azure thrown around in conjunction with dbt. While these don’t have much to do with how dbt runs, like Github, these are actually platforms that allow you to store your written dbt code. They’re frequently used with dbt, but they aren’t necessary to actually run dbt.
In fact, many people (myself included) don’t use either when running their dbt data models! Most teams with multiple analysts or engineers tend to lead towards a collaborative code-storage platform like Github, but the storage method you choose all depends on how your team has set up its development environment.
Regardless of which you choose, you can think of these as a pantry to store your tools and cookbooks. They don’t do any of the actual cooking.
Why should I care?
Now the most important part. Why should YOU care about dbt?! I mean, you aren’t the one using it every day – that’s the analytics engineer’s job. Well, the stakeholders for the dbt-built data models are data analysts and business users alike. After all, you’re the one benefitting the most from your analytics engineer using dbt to create data models.
Think of your team’s analytics engineer as the Julia Child of the kitchen; they’re the author of that cookbook that’s used by everyone else within the data team, altogether streamlining your workflows and eliminating the need for trial and error.
Faster data pipelines and reports
By making the data analyst’s life easier, the analytics engineer helps business users get the information they want faster. Data analysts use the dbt data models as a “shortcut” because the datasets they need are already waiting for them within the data warehouse. They don’t need to do any of the complicated aggregations and joins that may be required in a requested report – everything they need was already done within the data model.
Since all the complicated calculations are done using dbt, the queries are running directly within the data warehouse, increasing speed. If these same calculations were done within the visualization platform used by data analysts, you’d have to deal with much longer run times, delaying the lead times on your report. dbt allows you to get real-time insights rather than waiting days for what you need.
To further decrease run-time and computing costs, dbt also offers something called incremental data models. So, instead of running the data model’s code against ALL of the data within the warehouse, it only runs it against data that has been loaded in since the last time it was run.
With faster run-time, your data is available to you faster, eliminating the need to refresh your dashboards every 10 minutes while you wait for yesterday’s data to load in. Trust me, I’ve seen data models built without dbt that take hours to run. They cause a huge bottleneck and are frustrating to all involved parties: Those that depend on the dashboard as well as the analytics engineers that need to fix it.
Standardizes core KPIs
dbt is powerful. It standardizes business definitions across data models, allowing you to reuse code so you don’t have to repeat calculations in order to track your core KPIs. Because your code is reused, your core calculations are done once and applied to all of your data models.
Personally, I’ve found that de-centralized KPIs are a huge problem within the business-world. Each team may be looking at revenue, but they’re all using a completely different calculation for revenue. Instead of leaving these calculations up to the individual teams, these should be centrally calculated and used by every team.
The standardization of core KPIs is left to the central data team with a window into every business unit, allowing for better data management, a more accurate representation of your data, and better business decisions.
What’s more concerning, though, is that many teams don’t even realize this is a problem until a centralized data team is brought in to fix it. When all different areas of the business are modeling decisions after their self-calculated KPIs, your data quality suffers – and data that should be valuable is essentially pointless. Data is meant to increase the accuracy of our decisions, but how are we supposed to make accurate decisions when our KPI calculations aren't streamlined across the business? 🤔
Documentation
How many times have you looked at a dataset or model with no idea of what the columns mean? With dbt’s built-in documentation, analytics engineers can include data definitions right next to their code.
Since this documentation is now readily available, dbt allows engineers to easily include explanations of what their models mean with the calculations behind core KPIs. It also includes version control, so you can be sure to use the right piece of data or ask your data analyst for the right report.
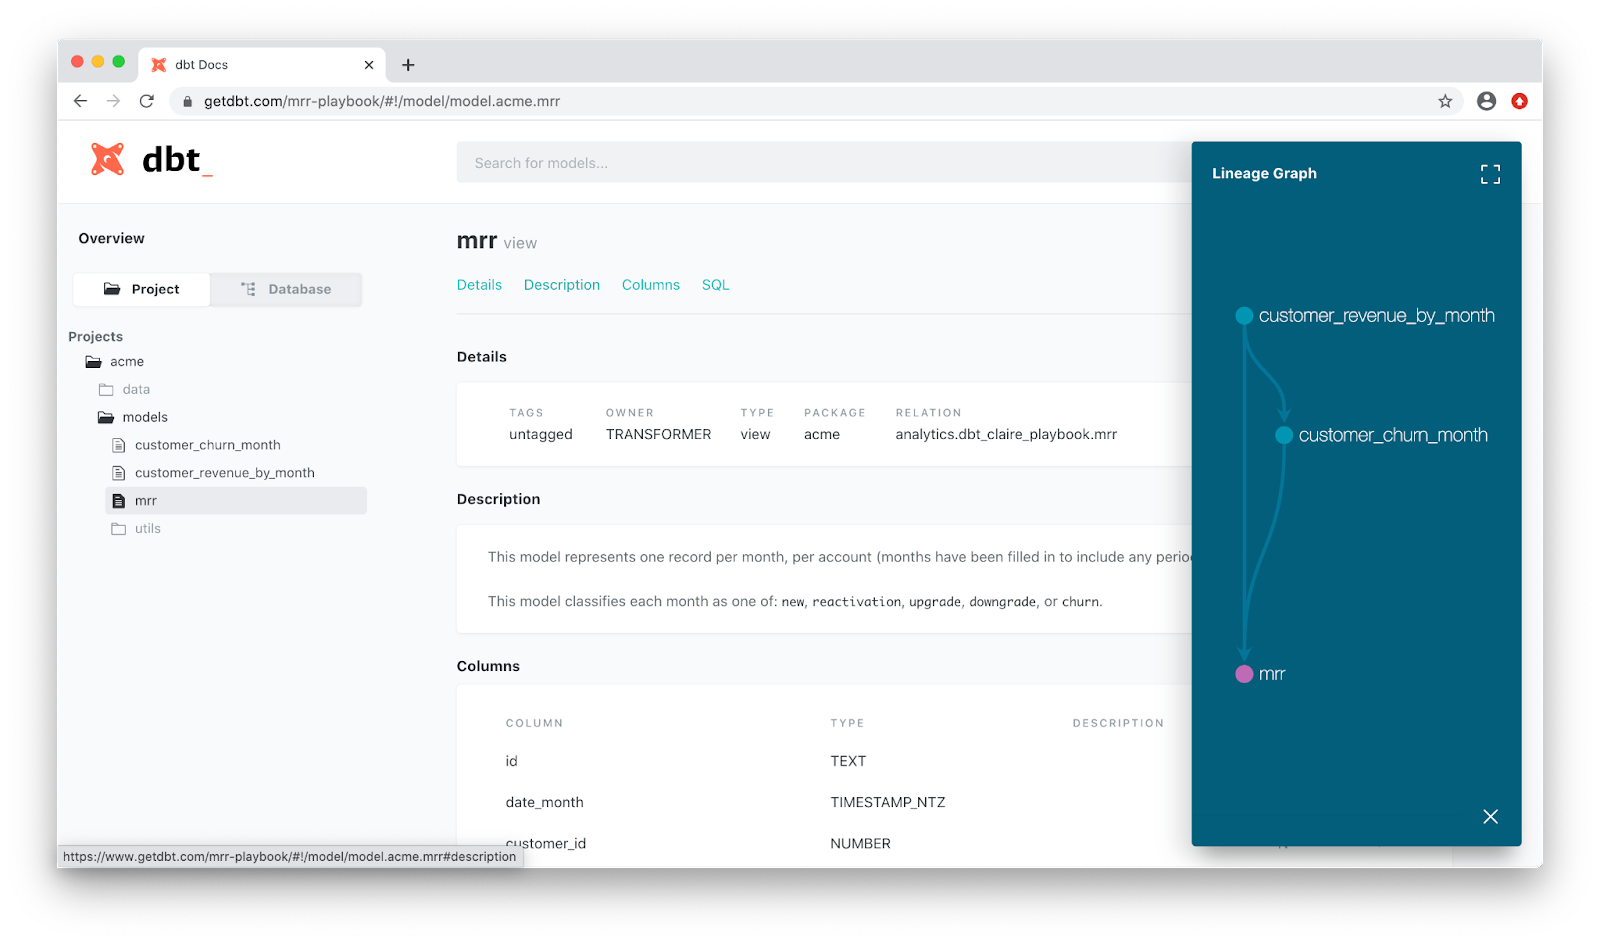
Better yet, dbt offers the ability to “serve” these docs into a user-friendly UI that anyone within the business can access, making it easy to read and find exactly what you need, when you need it.
Though this feature is super under-rated, it’s extremely powerful. The more transparency that is built into your data, the more impactful it can be for the business. By building transparency into the data that’s available in your data warehouse, you're increasing the potential for all that you can do with your company’s data.
Your best meal yet
Cooking a meal requires incredible synchronicity in the kitchen – just like creating a data model requires different tools working together. A data warehouse acts as the kitchen where all of the magic happens. SQL represents the hands and utensils used within the kitchen to craft your meal. The end product of all of the hard work that goes on is your dataset, or in this case, your meal. With a dbt cookbook in hand, you have the instructions you need to create a helpful data model. And with Julia Child (analytics engineer) as your cookbook author, you know your final meal will be extraordinary. 🧑🍳
Lucky for you, you get to enjoy the first few delicious bites of the meal! Business users and data analysts benefit the most from their analytics engineers utilizing dbt. Faster run-times allow for faster and more accurate data models to be available within the data warehouse, helping to standardize core KPIs across multiple business teams and ensuring all teams are using the same calculations. Most importantly, dbt builds transparency into your available data, creating a self-service data culture.
If you're looking to increase your business impact event more, Census plus dbt provides a powerful way for you to share streamlined versions of your company’s data with tools like Zendesk, Salesforce, Intercom and more. So, your data models are not only delivered faster, but are centralized across different applications and teams.
Want to learn more from data practitioners like Madison? Register to join our Summer Community Days! ☀️ Enjoy sessions from the data practitioners you know and love (plus some new perspectives) in our two-day virtual, practitioner-first conference. Whether you’re technical- or business-focused, new to the space or a seasoned professional (or maybe somewhere in between): There’s something for you.
Not yet part of The Operational Analytics Club? Join now. 🙌