


Understanding your customers and their behaviors are the pinnacle to any successful startup, which is exactly what cohort analyses are for. A Cohort Analysis is an extremely useful tool that allows you to gather insights pertaining to customer churn, lifetime value, product engagement, stickiness, and more.
Cohort analyses are especially useful for improving user onboardings, product development, and marketing tactics. What makes cohort analyses so powerful is that they’re essentially a 3-dimensional visualization, where you can compare a value/metric across different segments over time.
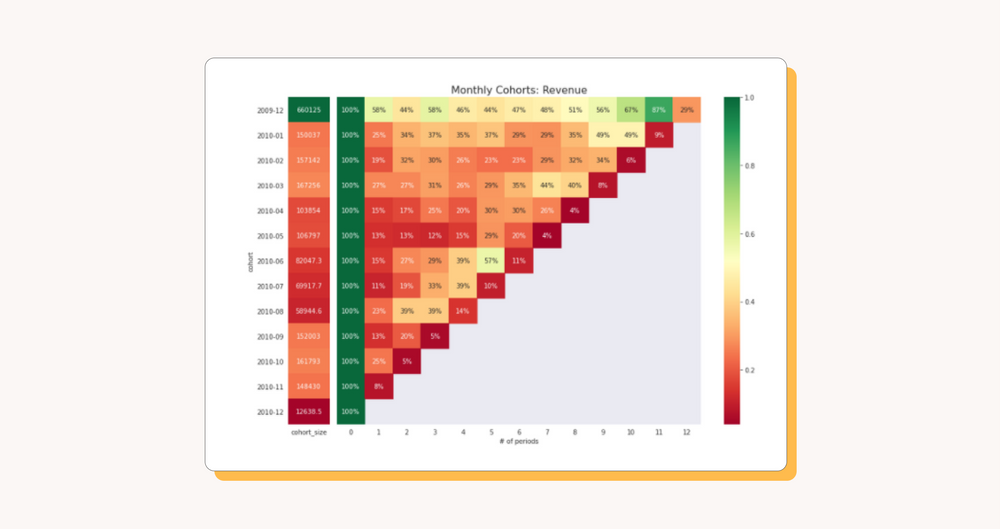
By the end of this article, you’ll learn how to create something like this:
If you’re not exactly sure what you’re looking at or why this would be useful, stay tuned and keep reading.
What is a Cohort Analysis?
In order to understand what a cohort analysis is, you first need to understand what a cohort is. A cohort is simply a group of people who have something in common.Therefore, a cohort analysis is simply an analysis of several different cohorts (i.e. groups of customers) to get a better understanding of behaviors, patterns, and trends. If this doesn’t make complete sense yet, keep reading and I promise you it will!
Type of Cohorts
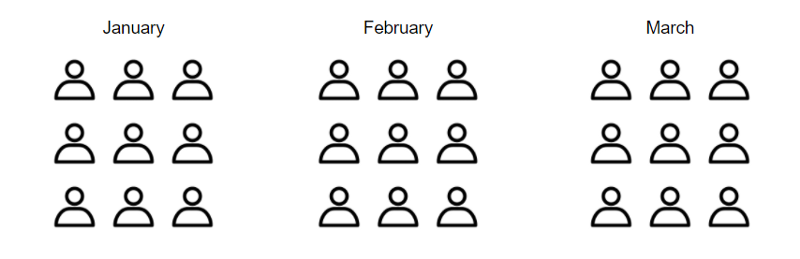
One of the most common types of cohort analyses looks at time-based cohorts which groups users/customers by specific time-frames. For example, a company might want to see how its customers who started using the product or started paying in January compare to February’s customers.
Segment-based cohorts represent groups of customers that used or purchased a particular product or service. For example, you could segment your users based on the amount of time they log into your app on a weekly basis.
Another type of cohort is a sized-based cohort, which is segmenting customers by their monetary value. This is a common practice in the gaming industry (free users vs whale) or in the SaaS world by segmenting customers by their LTV or plan they are on.
For the remainder of this article, we’re going to focus solely on implementing Time-Based, Revenue Cohort Analyses.
Required Data for a Cohort Analysis
Before starting a cohort analysis, the following data is required:
- Revenue data linked to the data of purchase
- A unique identifier for your users, like a customer ID or account ID
- An initial start date for each user, whether that be the signup date or the first payment.
For example, you might have a table that looks similar to this:
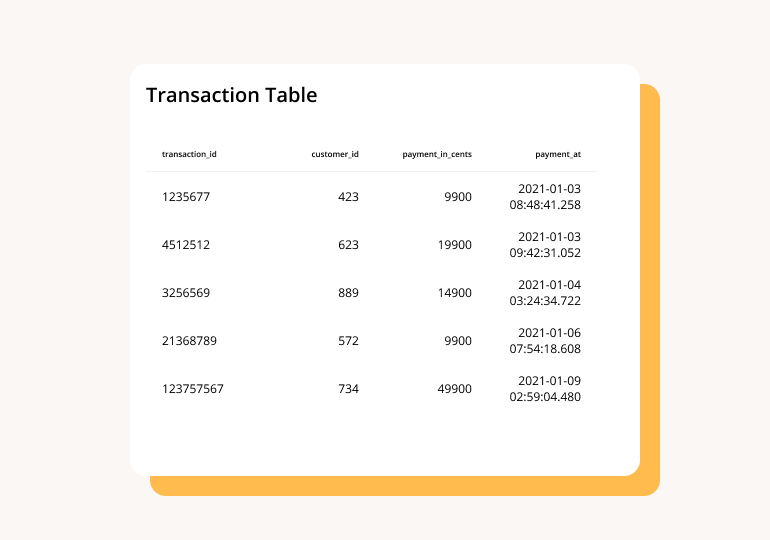
When conducting a cohort analysis in SQL, the goal is to generally manipulate the data in a particular format and then ingest the result into a BI tool, like Sisense, Mode, Looker, etc.
Say we were working with the table above, we could use SQL to manipulate the data in the following fashion:
1. Create Cohorts
First, we want to bucket the users into cohorts - in this case, we want to bucket them by their Order Date.
with user_cohorts as (
    SELECT  customerId
            , MIN(DATE_TRUNC('MONTH', orderDate)) as cohortMonth
    FROM orders
    GROUP BY 1
)
Next we want to create an order_month variable. For example, a payment that a customer made one month after their initial payment would have an order_month of 2.
with order_month as (
    SELECT  customerId
            , DATE_DIFF(
                MONTH,
                cohortMonth,
                DATE_TRUNC('MONTH', orderDate)
            ) as month_number
            , SUM(revenue) as revenue
    FROM orders
    LEFT JOIN user_cohorts USING(customerId)
    GROUP BY 1, 2
)
Taking a step back, we can now aggregate revenue by cohortMonth which was created in the first step. This will allow us to create our rentention_table.
with cohort_size as (
    SELECT  sum(revenue) as revenue
            , cohortMonth
    FROM orders
    LEFT JOIN user_cohorts USING (customer_id)
    GROUP BY 1
    ORDER BY 1
)

with retention_table as (
    SELECT  c.cohortMonth
            , o.month_number
            , sum(revenue) as revenue
    FROM order_month o
    LEFT JOIN user_cohorts c USING (customerId)
)

SELECT  r.cohortMonth
        , s.revenue as totalRevenue
        , r.month_number
        , r.revenue / s.revenue as percentage
FROM retention_table r
LEFT JOIN cohort_size s USING (cohortMonth)
WHERE r.cohortMonth IS NOT NULL
ORDER BY 1, 3
And now, you should have your data in a format that is digestible by a business intelligence tool that supports cohort analyses (or there is always Excel 🤣)
Here are some tips to help you navigate this visualization:
- Each row represents a cohort. In this case, a cohort represents a given month-year.
- The cohort size (bar on the left) shows the baseline revenue for each cohort, aka the total revenue from month 0.
- The percentages are relative to each cohort’s revenue in month 0.
The Value in Conducting a Cohort Analysis
“A picture equals a thousand words”
Cohort analyses are not only useful to measure and evaluate revenue related trends such as NET MRR retention, Customer Churn, Lifetime revenue, etc but it can also help with the following:
- User behavior: a cohort analysis allows you to understand the lifetime of a cohort, and so, it allows you to get a better understanding of how customers engage with a business over their lifetime. In the example above, we can immediately notice that sales are repeat sales are generally higher around Christmas.
- Compare groups: whether you segment cohorts by time periods or products or something else, a cohort analysis allows you to compare different groups. Notice in the example above that the first cohort has a much higher percentage of repeat sales compared to the other cohorts. By identifying that, you can then look into possible reasons for why the first cohort is purchasing more.Customer churn & Lifetime value: Lastly, a cohort analysis allows you to calculate useful metrics like churn and lifetime value. By understanding the differences in churn and lifetime value across different cohorts, you can learn from cohorts with a low churn rate and cohorts with a high lifetime value.
What's Next?
With Census, you could send the cohort membership to an email marketing tools or your CRM and take action based on that data. For example, send a reactivation or education campaign to a cohort that is not performing very well. You can do that with no code by using Census. If you are interested to learn more, contact us! Or want to check Census out yourself? Start your free trial.