


Over the past decade there's been plenty of advice for startups on picking a great metric to focus on growth. Since starting Census, I've been curious to see how the best CS teams apply this thinking to their work and help customers get the most from the software that they buy. In my experience, it's a lot easier to focus on fewer metrics: you can ensure they're computed correctly and that teams actually use them to prioritize their work. This post highlights a metric that we've helped Pete Kazanjy deploy at Atrium that should work as a starting point for most B2B SaaS companies.
Why effective Customer Success is essential
While it may sound like old advice by now, it’s important for SaaS companies to invest in Customer Success today. This is especially true with the rise of product-led software adoption (aka “bottom-up growth”). A recent study showed that great companies have a net revenue retention of 110% to 130%. While your core product plays the starring role in this task, a good Customer Success team can also have a huge impact.
- Ensuring customers are getting everything out of the services they’ve purchased leads to happier users, which in turn leads to more organic growth.
- Building a “land & expand” approach to growth can be accelerated by a CS team identifying internal opportunities.
The hard problem is how to make your CS team effective. Ideally each member of the team is assigned 10+ customers. How do they know which users to prioritize? You need good metrics to indicate how they’re adopting your product without forcing them to explore each customer individually in your BI tools.
Focus on leading indicators
There’s no shortage of business metrics experts will recommend across categories like Churn Management, Expansion Prospecting, or Customer Satisfaction. Here are some classic examples.
- Churn: Customer Churn %, MRR Churn %, Net MRR Churn %
- Expansion Revenue: Expansion MRR %, Gross Renewal Rate, Net Revenue Retention
- Customer Satisfaction: Net Promotor Score (NPS), Customer Satisfaction Score (CSAT)
While these are all metrics you should be tracking, they are ill-suited to prioritizing the work of your Customer Success team. The revenue metrics are great for the business, but it doesn’t help an individual CSM do their job or prioritize their time. Tracking customer satisfaction is a more visceral indicator that people are happy with your product but this is still reactive to their feedback rather than proactive based on their activity. Ultimately, these are all lagging indicators. By the time someone is about to downgrade, it’s too late to act.
The goal of your CS team is to prevent all of the metrics above from falling in the first place! What you need is an operational analytics metric that can answer questions like these:
- Who are our power users?
- Which account needs to be educated on new features?
- Which account is at risk of churning?
- Which account is not using all of the products/features they purchased?
Why a Product Activity Coefficient is a great metric for Success
What you need is a metric built on your product usage data that is easy to understand by anyone in the company and is a leading indicator so the CS team can be proactive and help customers before it is too late.
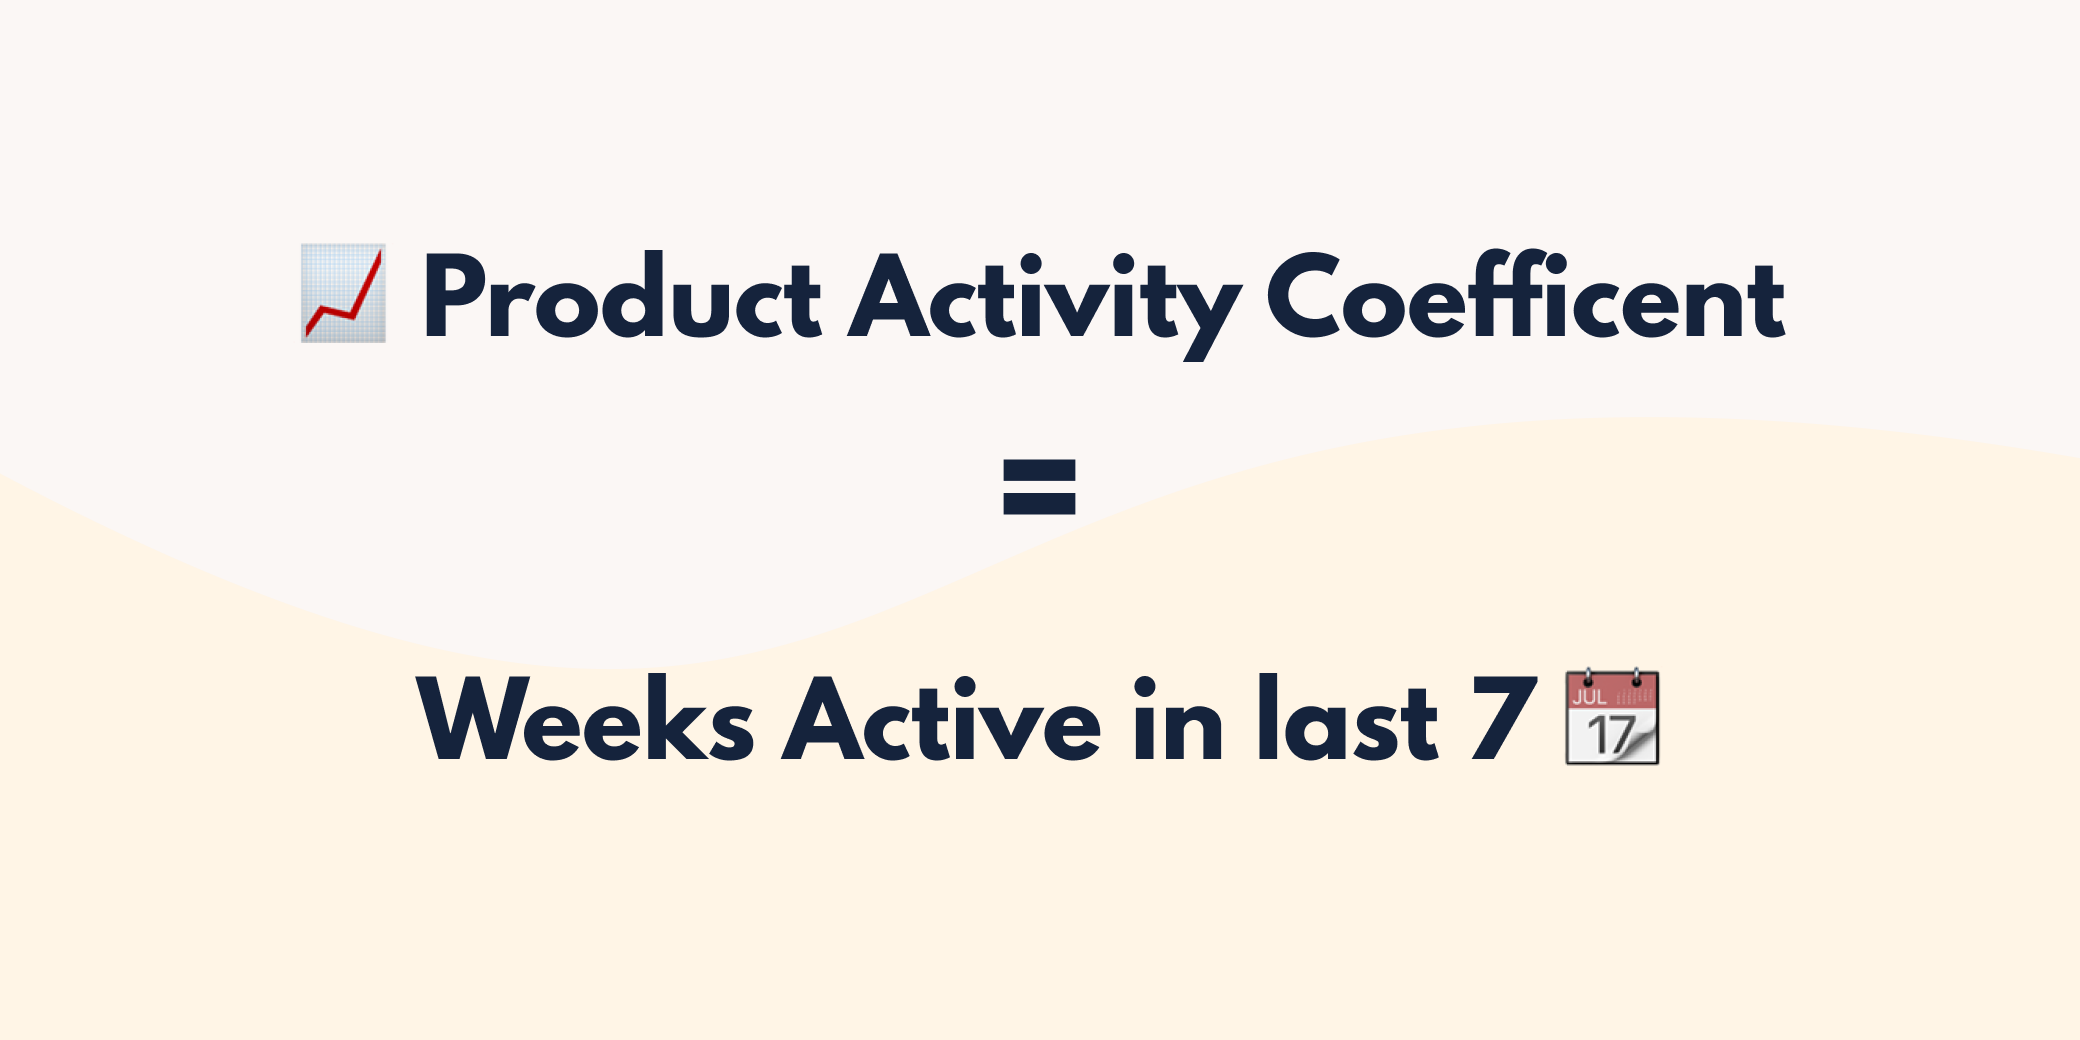
This is where the Product Activity Coefficient comes in. To measure it, you simply count the number of weeks a customer has been active out of the last 7 weeks. The lowest score is 0, the highest is 7. Simple.
The power in this kind of metric is that it’s normalized across any user and it represents their level of engagement with your product. It is similar in this respect to user metrics championed by big consumer product teams. Growth teams at companies like Facebook & Netflix use metrics like DAU/MAU to track engagement because these quotients focus on turning their user base as a whole into more frequent users. We picked a weekly cadence as it’s a reasonable baseline for a B2B SaaS product (that users engage with it at least once a week). The key difference between general user engagement metrics and the coefficient we use here is that this one is focused on a single user (or account).
Putting this in practice
To measure product activity, you need to define what an active user looks like. This is unique to your business but it should be a score that your team can understand and decompose (ie. you don’t need to hire a data scientist for this). In many cases your product & growth teams are already thinking about it. What is the key value of your product? Which part of your product provides that value? Here’s some examples.
- Atrium helps sales leaders understand the performance of their team. The value is provided via the different pre-built dashboards (sales manager level, rep level, etc). So the more views these pages get, the better.
- Loom helps their users communicate more effectively by using video. The value they provide can be tracked by how many videos each user creates and how many views they get.
- Here at Census, we help customers sync their data from their data warehouse to business tools. The more data they sync, the more value they get. Therefore, we measure activity by the number of live syncs and the amount of data being synced.
Once you’ve defined what an active user is, you can compute the coefficient wherever you do BI. For example, let’s say you have an event stream from Segment landing in your data warehouse and you’ve decided that page views of your dashboard constitute activity. Here’s a SQL query for generating the metric.
SELECT
	user_id,
	COUNT(*) AS product_activity_coeff
FROM (
	SELECT DISTINCT
    	user_id,
    	DATEDIFF(week, timestamp, CURRENT_DATE) AS weeks_ago
  	FROM segment.tracks
  	WHERE event = 'viewed_dashboard'
)
WHERE weeks_ago < 6
GROUP BY user_id
The final step is deploying this metric into whatever tool your Customer Success uses to track its accounts. If you don’t have a dedicated CS tool, you can always use your CRM. This is where Census can help; we help you sync your data from your data warehouse to your business tools so metrics such as Product Activity are always up-to-date. (We call this reverse ETL.)
What’s Next?
Now that you have the Product Activity Coefficient in place, you can generate reports to classify users.
- Low Product Activity Score → At Risk account that needs CSM attention
- High Product Activity Score → Power users with whom you should discuss product expansion, case studies, and get to act as evangelists for your business in their community
Once you’ve mastered this metric, you’re ready to layer in more. I’ll mention two kinds of metrics that most CS teams should add as they grow. Feature usage metrics allow you to understand if various personas are using the right features and to identify expansion opportunities. The team at Atrium syncs these metrics into their CRM where they look for users who have a certain role (e.g. sales director vs. sales rep) that aren’t using a feature designed for them. Account level metrics help you understand whether a customer is using all the seats they’ve purchased or nearing their usage quotas.
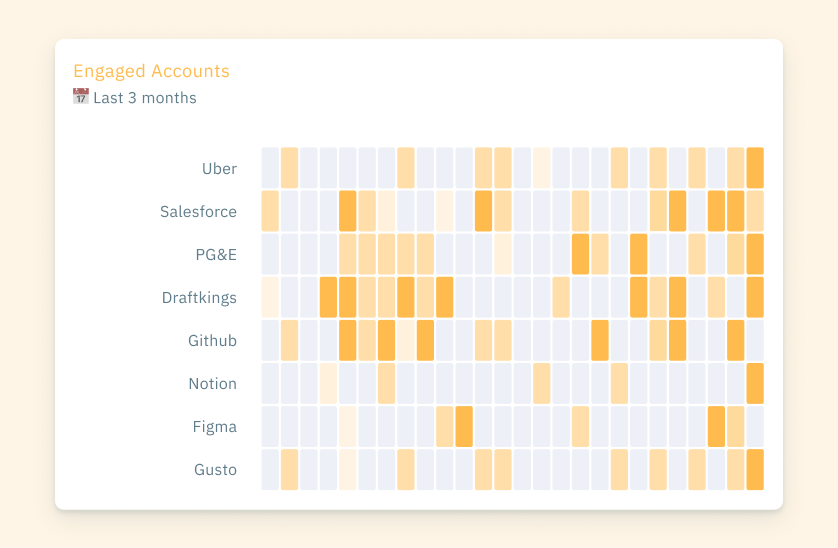
As an extra bonus, you can visualize these metrics over time. For an example of how to do this, you can check out our previous post about sparklines.