


After Coalesce in New Orleans last month, I went straight to Chicago. My mom picked me up from the airport, asked me where I was, and when I told her I was at a dbt conference, a familiar guessing game ensued: One where she tries to guess what the various jargon-y acronyms in data mean. For “dbt” she got “data” right away, with which we both were quite happy. But then she landed on “business transition” as the “bt” part.
While we all know that’s not actually correct, as I thought about it more, “dbt as data business transition” became a better and better summary of my Coalesce conference experience this year.
I joined the dbt community nearly two years ago while standing up the MDS (Fivetran, Snowflake, dbt, and Census) at Owner.com. Back then (in my day), the Slack community was only about half what it is now (if you want to learn more about how it’s changed, check out the work of Benn Stancil and Taylor Murphy). I immediately loved how welcomed I felt as I dug into new tools and the analytics engineering framework.
It’s wild to see how dbt has grown, especially at the end of Coalesce, which I think is one of the best – if not the best – conferences I’ve been to. The dbt Labs crew did a great job coordinating and scheduling talks (many of which were given by OA Club community members 🙌), running a fun Expo Hall, and weaving in New Orleans flair.

So, while I reflect on the many awesome community experiences I had this year, I wanted to highlight some of my favorite moments from the event (mostly focused on business applications of analytics engineering and dbt).
Bonus: If you’re looking for a great roundup of Coalesce talks on career growth, check out this post from Metaplane’s Founder & CEO Kevin Hu.
Tuesday: The return of analytics engineering, Kimball, why data-led is dumb & more
Tuesday was definitely my heaviest session day. Here are some of my favorites (in no particular order).
“Return on Analytics Engineering” by David Jayatillake, head of data @ Metaplane
David’s blog post recap is here and the session recording is here.
In this talk, David speaks about three key benefits of analytics engineering
- Collaboration, illustrated by the “hit by a bus” analytics, where good analytics engineering helps the business pick up and carry on thanks to good documentation.
- Quality, explained by DRYness (AKA “don’t repeat yourself”), which is a core tenet of good dbt project hygiene.
- Value, where he talked about the spiritual level of “data shame” (which really struck a chord) that ensues when a stakeholder pings you that a dashboard broke. Here, he also highlighted the value of safety in building with data, especially by denoting which data was free to play and build on.
Overall, I would recommend this overview of analytics engineering’s impact from a technical and organizational perspective. I appreciated David’s coverage of data teams as cost centers and their technical impact, though I’d love to hear more of his perspective on an objective function around ROI versus KPIs.
“Babies and Bathwater: Is Kimball still relevant?” by Sydney Burns, analytics engineer @ Webflow & Josh Devlin, analytics engineer @ Brooklyn Data Co.
You can find the talk recording for this session here.
Times have changed since Ralph Kimball published The Data Warehouse Toolkit in 1996, but a lot of the value of dimensional modeling has remained.
Now in a quasi-storage-unlimited world, some of the justifications of the techniques for minimizing storage requirements aren't as true. The age of ETL has become ELT, with transformation no longer happening in-flight, but rather within the warehouse with SQL and dbt.
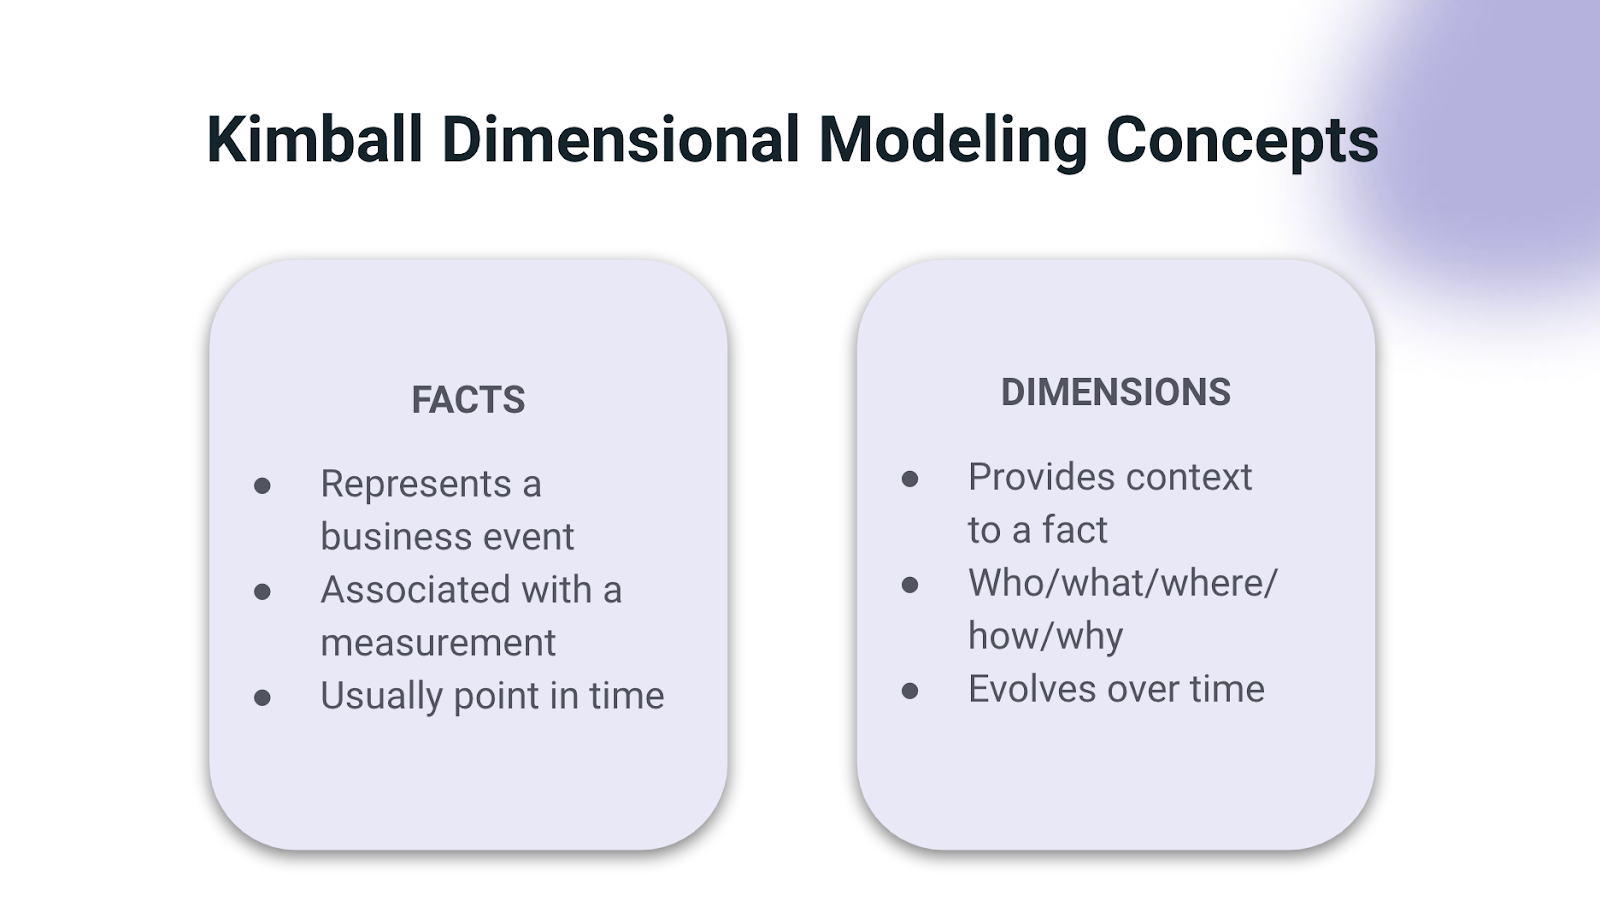
The big pro of dimensional modeling is that it’s very understandable. Fact and dimension tables make sense of data structure, communicating them via two concepts (seen below):
The key takeaway from this talk? Just be thoughtful when data modeling. Don’t throw the baby out with the bathwater by ignoring the benefits of Kimball.
Bonus: If you want some additional reading, Sydney and Josh recommended reading Star Schema by Christopher Adamson.
“The ‘easy way’ to launch analytics at a startup” by John Kennedy, VP of business technology & Lindsay Murphy, director of analytics @ Maple
You can find the talk recording here.
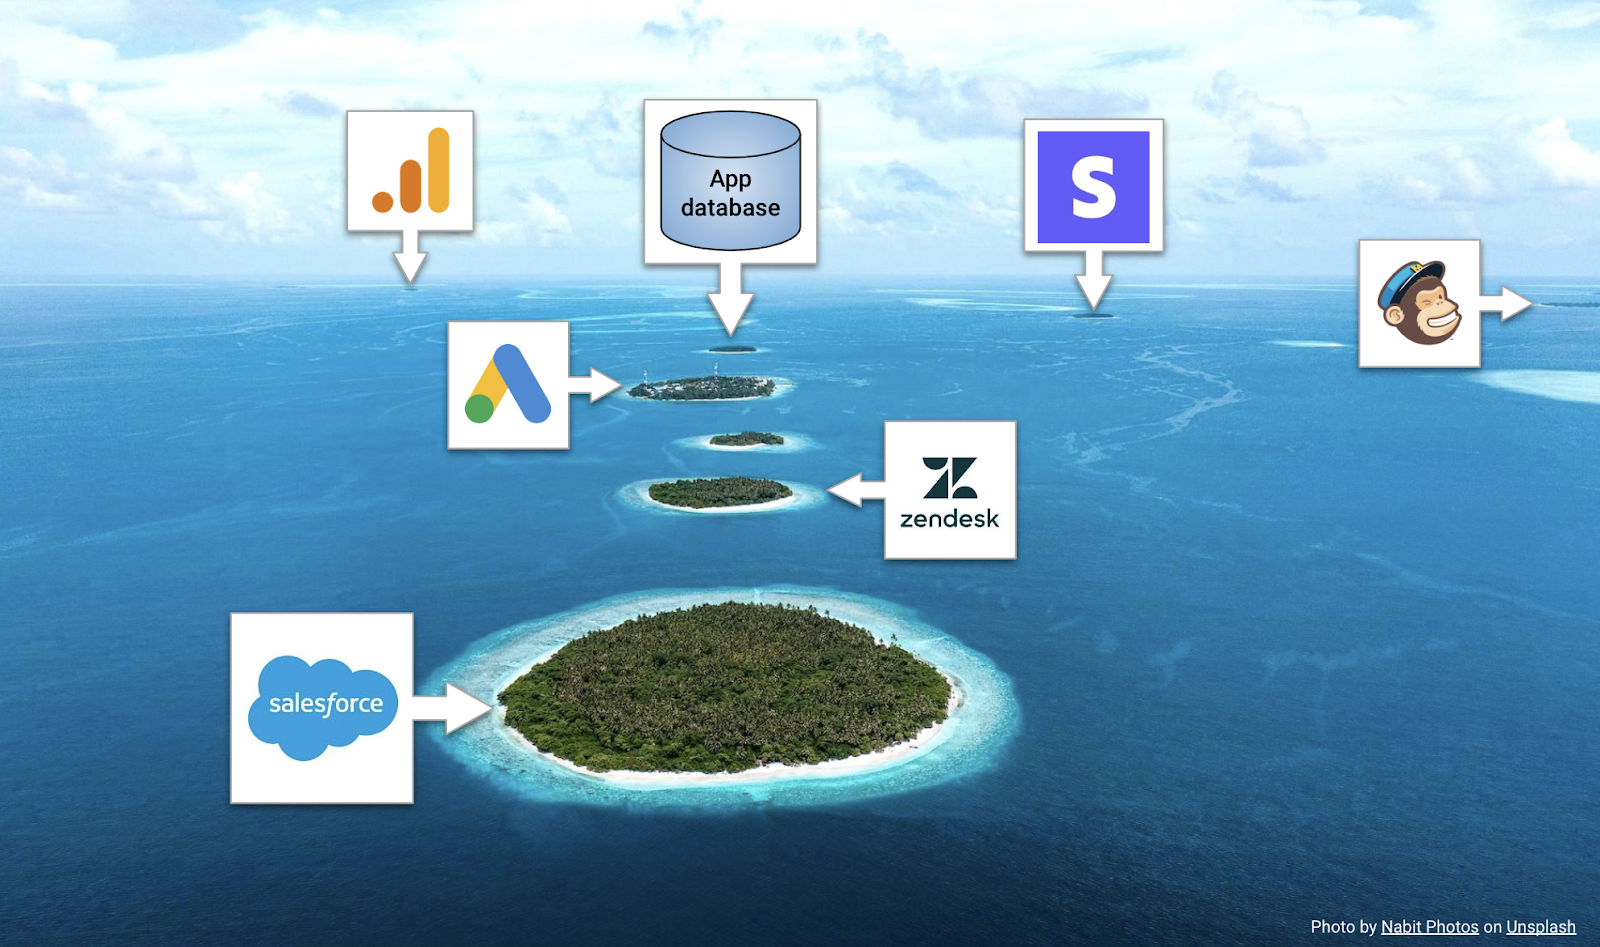
John and Lindsay opened their talk by diving into how data silos started in early-stage companies (illustrated by the great visual below).
But they really connected with the audience by turning focus to the first data person (or FDP) at a startup, a role many of us (including myself) have served in.
When it came to the responsibilities of the FDP, they called out two priorities:
- Teaching stakeholders how to fish (AKA self-serving trusted analytics)
- Getting quick wins (AKA iterating fast by buying over building)
And, beyond these two areas, Lindsay highlighted a hot take focus area I’m really in favor of: FDPs should teach tech skills when they join and have six months of lead time that includes three months hiring and three months of onboarding. I think this lets you teach SQL skills faster, given curiosity, analytical thinking, and communication skills are already present.
This is a must-watch for any FDPs at startups, including founders and ops leaders thinking about scaling the data team, and a great playbook on how to add value as soon as possible in a new role.
“Data-led is dumb” by Emilie Schario, formerly of Netlify and Amplify
You can find this talk recording here.
Emilie did an awesome job laying the framework of how data and experimentation results don’t have full context via examples of Jane Fonda’s exclusion from a Netflix title card experiment where Jane Fonda was excluded from promotion materials based on misleading data (correlation =/= causation, anyone?).
Emilie used these examples to set up the takedown of Reforge’s post by Crystal Widjaja, which positions data-informed => data-driven => data-led as the transitive states of an organization’s journey to leveraging data. Emilie contests (and I wholeheartedly agree) that, ultimately, being data-led is dumb because data doesn’t tell the whole story. In fact, data:
- Depends on instrumentation
- Heavily relies on contextual knowledge
- Is not an end-all-be-all; it’s a representation of operational procedures
Instead, Emilie proposed a new phase of data as both a substitute and the “right way” to evolve data teams: Data as a Product to Data as Operations (for context on getting to Data as a Product, see this Coalesce 2020 talk by Emilie and Taylor).
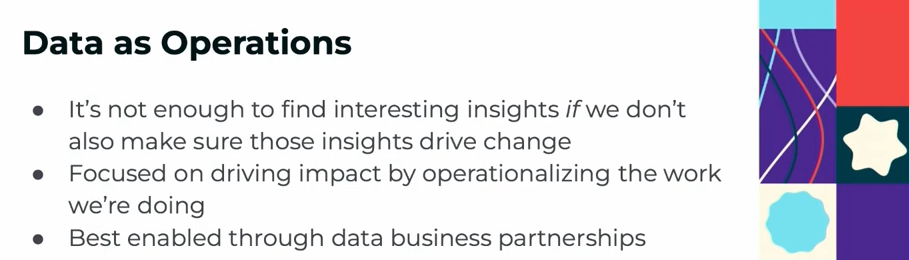
For any proactive data leader and practitioner, this is an absolute must-watch. Further reading on Data Business Partnerships can be found in this blog by Adam Stone.
“Data Change Management: Lessons Learned at Vouch” by Kshitij Aranke, senior data analytics engineer @ Vouch
You can find the talk recording here.
Kshitij did a great job explaining how to change an organization by bringing in best practices from software engineering. To start, he talked about change management in general (and why it’s important):
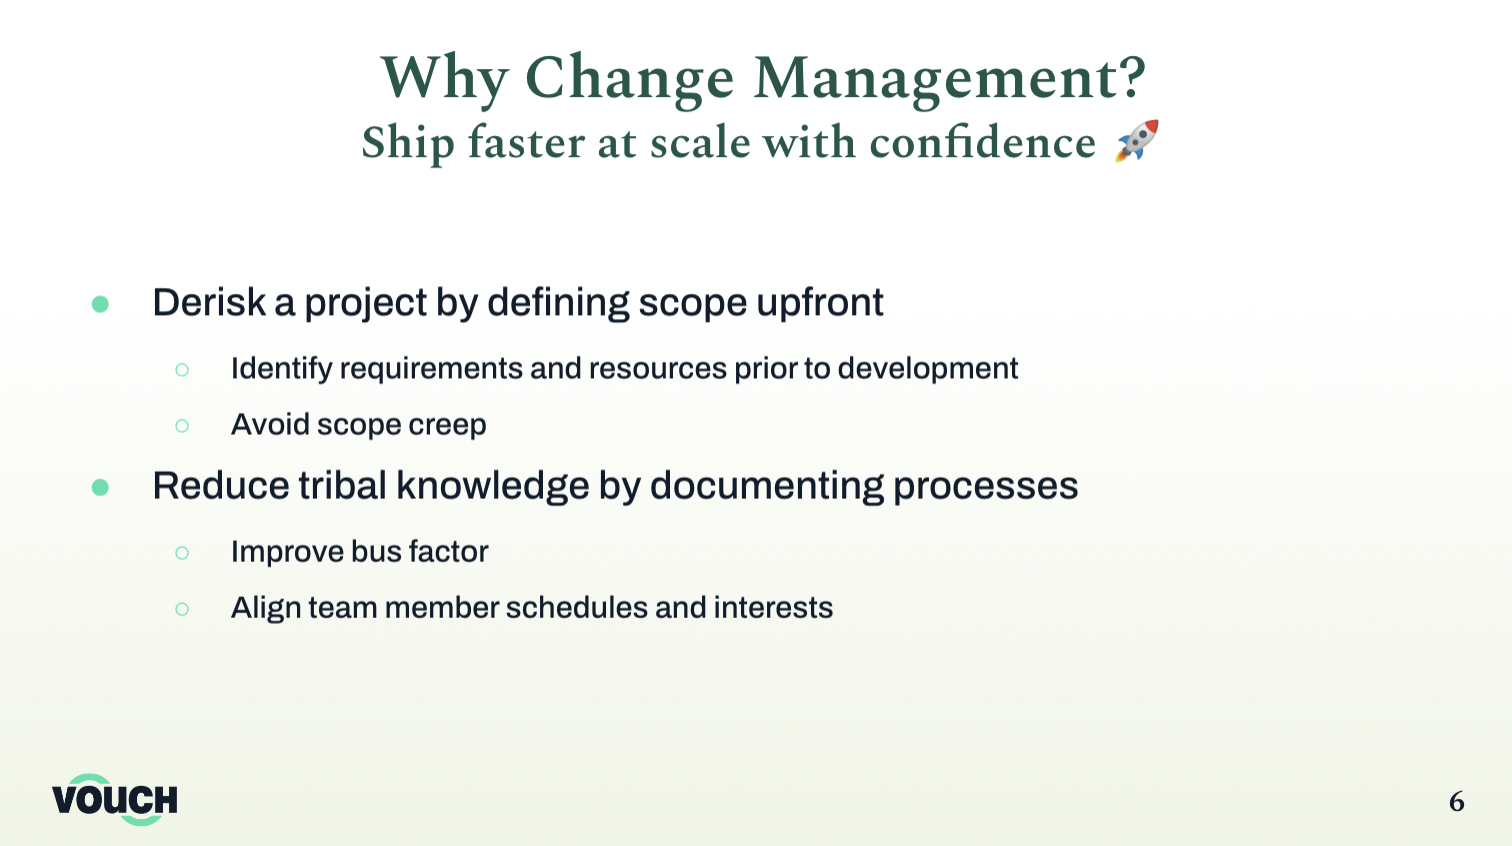
Note the “hit by a bus” analogy again 🚌, which was fitting as much of this talk touched on points from David’s earlier talk. The change management piece was around how to make sure new systems actually help teams ship analytics faster with confidence.
One great pattern he talked about was an Acceptance Criteria for new tickets that considered the following:
- Scenario
- Given
- When
- Then
- And
He chose these criteria because they focused on the “what” rather than the “how,” which gives everyone picking up the ticket the context needed to own its delivery.
He wrapped up by talking about guardrails for development and automated code review, specifically how analytics engineers have applied software engineering best practices (basically stating, “everything old is new again,” which I thought was a great final takeaway from the presentation). This is a great talk for data leaders building out a team to use as a north star template for a high-functioning team.
Wednesday, Thursday & Watchlist: Data alchemists, jsonschema & event-driven dbt models (oh my!)
Transparently, I spent most of my Wednesday and Thursday on the conference floor talking with community members about their work, so I didn’t catch as many sessions as I would have liked (thankfully, they’re all on demand), but here are my favorites I was able to drop in on. 👇
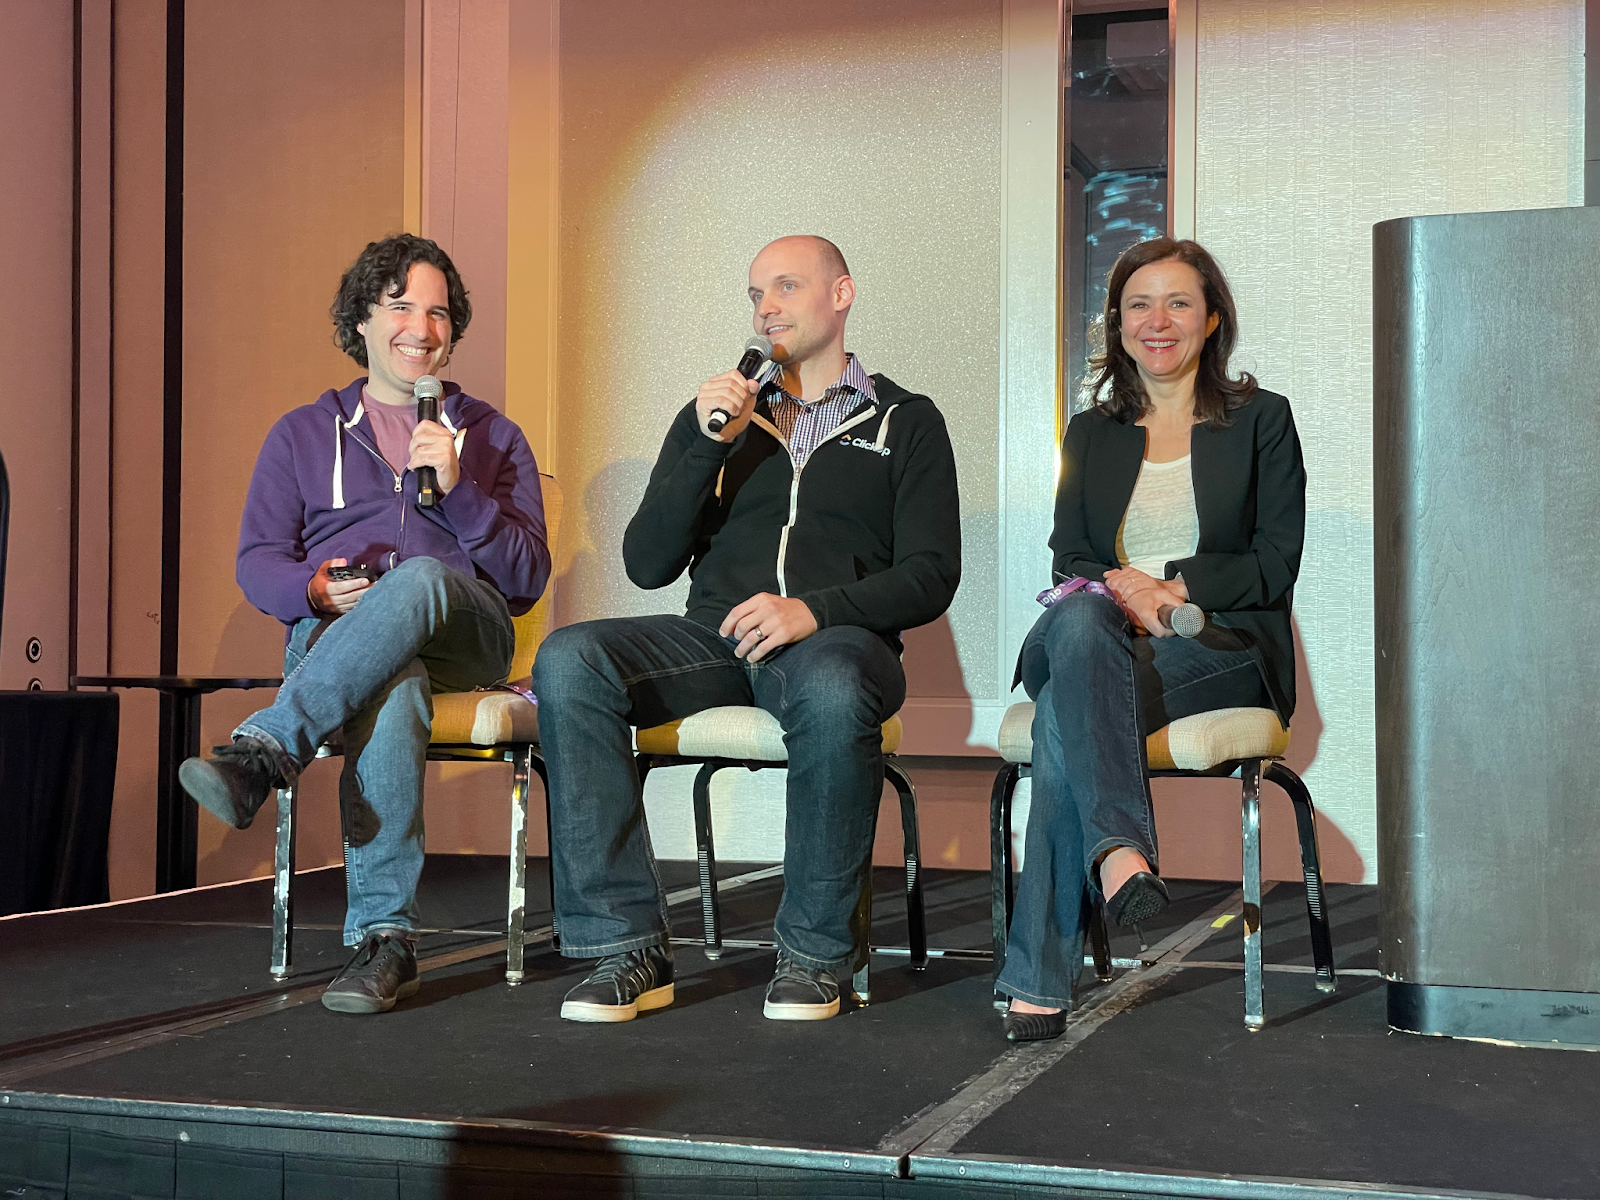
Turning Data into Gold: Meet the alchemists at Census, Carta, and ClickUp” by Boris Jabes (Census), Julia King (Carta) & Marc Stone (ClickUp)
You can find the talk recording here.
I always love catching Julia and Marc (and, of course, our very own Boris) on panels together. For this session, they touched on how to bridge data and analytics reporting with operational systems when stakeholders (like Sales) want to see how different data initiatives impact revenue.
Key takeaways from this session included:
- Tab-switching (AKA context-switching) between a CRM and BI tool (and waiting for each to load) costs more $$$ than most folks realize.
- Thinking about speed in terms of minutes/hours versus days/weeks leads to easier conversations between data and ops.
- Fostering shared responsibility and collaboration between data and systems teams (CRM/tool admins) in warehouse-first companies creates valuable feedback loops between ops and analytics teams.
This talk is excellent for data leaders looking to improve their working relationships with ops teams and better communicate the dollar value of their team’s work.
“Getting jiggy with jsonschema: The power of contracts for building data systems” by Jake Thomas (Okta) & Emily Hawkins (Drizly)
You can find the talk recording here.
This was an interesting talk on the various data assumptions that take place in the real world of clickstream data, including:
- event_id not being unique among events
- “scheduled” not being spelled correctly
- or a boolean field being null instead of True/False.
Emily gave great introductions to the “data is hard” feeling, jsonschema as a way to have validation of data types of fields, and the concept of an agreement.
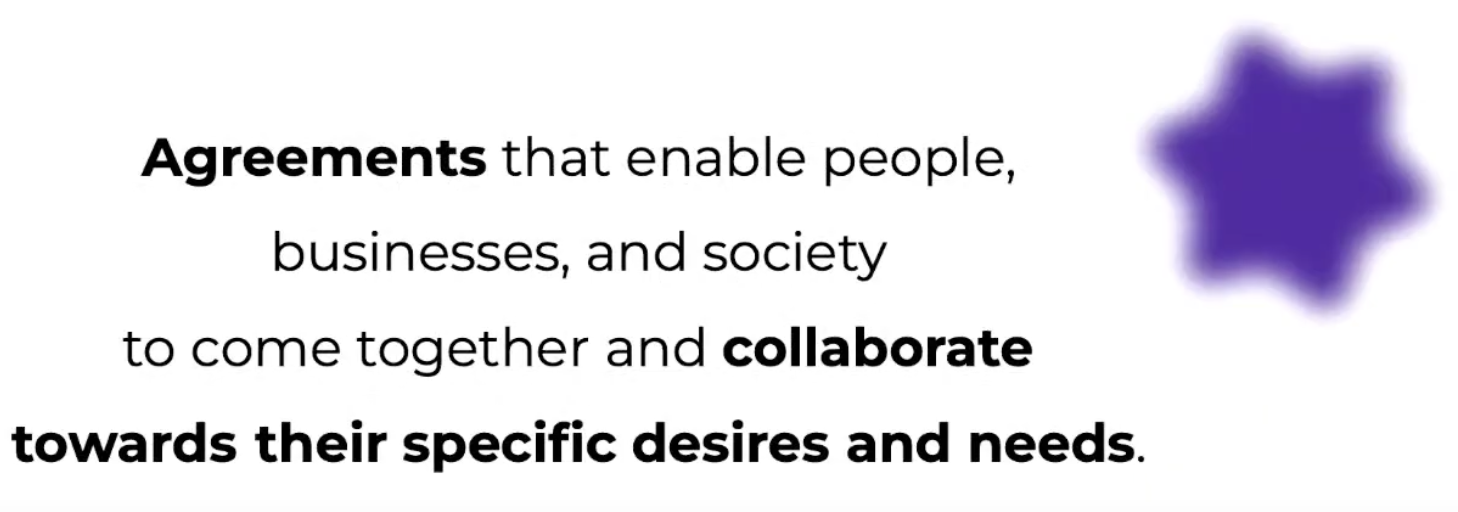
Jake covered the best practices for getting in front of downstream problems, including defining, annotating, and evolving the jsonschema agreement with product engineering teams before putting the agreement into a registry. This enables product SDKs, as well as dbt, to read from the registry and apply validators to event definitions.
This talk resonated with me thanks to the event issues I’ve come across in the past. It seems like an elegant solution to solving them (and necessitates great cross-functional buy-in from engineers, product, and leadership). I’d recommend this talk to data leaders focused on event data, plus frustrated product analysts looking for a great end-vision for contracts.
Related reading: Sarah Krasnik’s article on an analytics requirements document (ARD).
“When the Real World Messes with Your Schedule: Event Driven dbt Models for the MDS” by Dylan Hughes, engineering manager at Prefect
You can find the session recording here.
Dylan did a great job outlining the pros and cons of scheduling in this talk, shown here:
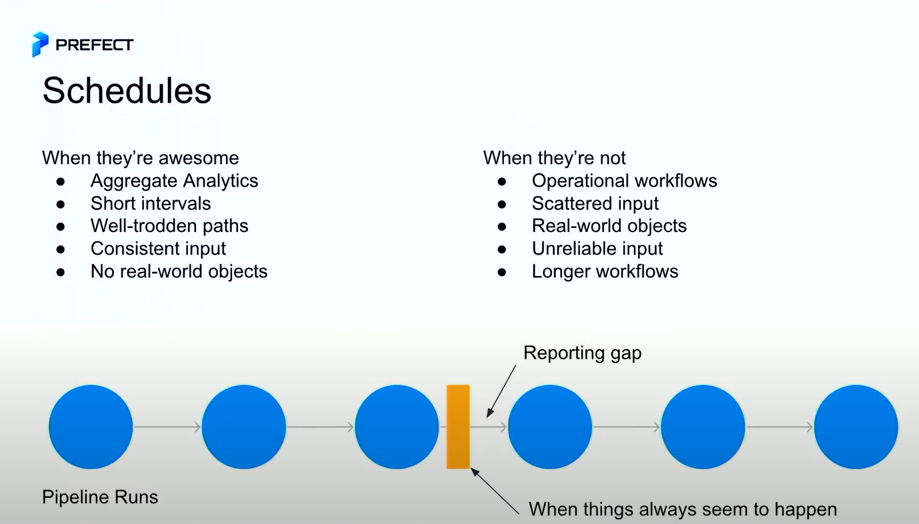
I felt this talk at my core, given my experience scheduling questions. The key takeaway?
The real world operates in events, and operational data workflows should mirror this reality.
As Dylan explained, event-driven dataflows are best because they:
- Reduce costs, only running when things change
- Reducing time-to-insights
Thinking first about the organizational outcomes at the design phase of a pipeline helps future-proof the questions about data discrepancies and drive the largest impact possible.
I’d highly recommend watching this entire talk as a data engineer. Dylan included a spectacular example scenario of data flows from BlueJet that ensured unsafe aircraft do not take off.
My watchlist: Data vs. the Recession, Salesforcelandia, design as daily activity, minimalist growth & how to write better about data
The best part about Coalesce? Just because the event is over doesn’t mean the learning is! Here are the talks I’m sad I missed, but I'm excited to catch on-demand:
- “Data Teams vs the Recession” by Chetan Sharma, of Eppo
- “Salesforcelandia –a magical land of Data and RevOps harmony” by Erika Pullum and Sean Heisler of Hex
- “Efficient is the New Sexy – a minimalist approach to Growth” by Matthieu Di Mercurio of Dialogue
- “The missing link: Design as a daily activity” by Ashley Sherwood of Hubspot
- “How to not be a terrible writer” by Justin Gage (head of developer marketing at Amplify)
Overall, I enjoyed and learned a lot from all the talks I caught this year. All the presenters did a fantastic job covering the future-proofing analytics engineering and best data practices, and were quite reaffirming of the Operational Analytics (OA) space (peep the “data business transition” rebrand 👀) I spend a lot of time in at Census.
If you’re interested in learning more about OA and learning from the data community, join The OA Club, or reach out to me directly. I’m always happy to talk to other data nerds! 🤓