


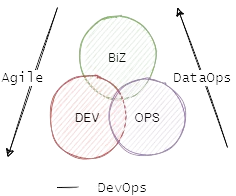
Together, agile development and DevOps have created a growing demand for data. Businesses want to be able to make insightful decisions and grow according to metrics they gather from developer processes and client interactions, but this sheer volume of data can prove to be a huge bottleneck in the decision-making process.
Enter DataOps, a framework to ensure that your business has the data it needs to pursue new ideas and the ability to make use of it. The main difference is that while DevOps involves engineering, developing, and delivering software applications, DataOps builds, tests, and releases data products. Because data is obviously different from software, each discipline requires different sharpened skill sets and team collaboration styles to be as effective as possible. 💯
That’s a pretty basic explanation, so buckle up, folks! This article is talking about all things DevOps and DataOps. Sure, they may share some core principles like culture, lean, automation, measurement, and sharing, but they’re implemented in totally different ways.
Trying to figure out if your organization should lean more toward the dev world or the data universe? We’ll help you sort that out by discussing a few deets, like:
- Best practices for each concept
- The value provided by each
- The areas that each framework aims to automate
- The similarities and differences between the two
And of course, by the end of this, you'll have some of the best DevOps lessons to carry into your world of data. 🌎
Let’s talk DevOps
So, let's dive in! Inspired by industrial engineering concepts and, more specifically, lean manufacturing, DevOps has become a systematic methodology for providing fast and reliable improvements to software products. Actually, DORA’s research program is a perfect example of how following DevOps principles can substantially reduce software release cycle time and reduce failures in the product lifecycle. 👏
Taking a page from their book, DevOps teams rely on two systems to provide feedback about how they perform. The first system measures how teams stack up to the four DORA metrics:
- Mean lead time for changes: Time it takes for the code to be committed until it’s successfully deployed in production.
- Deployment frequency: Frequency at which a new version of the software is released into production.
- Failure rate: Number of deployments in production that result in an issue.
- Mean time to recovery (MTTR): Time it takes to fix an issue after it has been identified in production.
The second measurement system for DevOps are the service-level indicator/service-level objectives (more commonly known as SLI/SLOs) which aim to not only identify the steady state of the system, but to create an alert when an important deviation occurs. For instance, an SLI could be the “time for a user to log in,” and the associated SLOs would set acceptable thresholds for that action.
Plainly put, DevOps exists to solve a major software pain point: To improve the speed and reliability of the software development process. Another large part of DevOps’ success, though, relies on the self-service model that fosters collaboration between developers and operations teams.
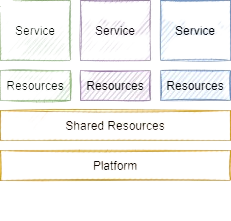
As this collaboration is nurtured, lean principles and automation start to make their way down the pipes. It sounds pretty basic on the surface, but over the past ten years, DevOps practitioners have built numerous tools to support these ambitions and share the benefits of streamlined processes across the entire company. As a result, the foundation of a modern DevOps stack heavily relies on a cloud provider that offers infrastructure as a service (IaaS), enabling a team to build its infrastructure the same way its developers would write code.
On top of the infrastructure, you build or operate a platform (such as Kubernetes) to simplify and uniformize IT operations. At the intermediary level are several shared services, like CI/CD machines, monitoring tools, and code and artifact repositories that are split into many different services – each with its own databases, caches, and queues as backing resources.
All resources are templated and available for the team to use and provision, resulting in best practices, pipelines, and automation scripts that are easy to share across the team.
Okay, so what’s DataOps?
Before DataOps, IT operations provided the foundation for the data infrastructure and data stream coming from the production environment. 🔧
- Data engineers took the raw data and handled the preparation and storage process.
- Data scientists enriched the data with a statistical model to provide predictions.
- Data analysts used the data to answer business-related questions and engaged with the business decision process.
As you can imagine, this heavily-siloed model created a tense, slow application development process. 😮💨
Data teams tried to build data lakes to accumulate data from all sources and make it available to users across the company. That all sounds good in theory, but this model had so many caveats that each department would feel like they weren’t getting the most of their data – and so the era of custom tools for each department was born. 🪄
Problem solved, right? Not quite.
This approach met each team’s individual needs, but it also meant that little to no communication occurred between the teams, making the overall data management process extremely ineffective and slowing data flows.
Cue DataOps.
DataOps promises to bring together all the data tribes in an organization: Data scientists, data engineers, data analysts, and IT operations. 🤝 By aligning these teams to work more collaboratively, continuous and efficient innovation opportunities start to emerge, streamlining data operations and development cycles.
The measurement method for DataOps is built on top of three basic parameters: Performance, security, and quality. While performance focuses on minimizing the time to turn ideas into consumable analytics (data time-to-value), data security essentially incorporates compliance with a regulatory requirement, such as GDPR. When it comes down to actually evaluating the data quality, statistical process control is used to characterize the data against six metrics:
🎯 Accuracy: Confidence that the data represents the truth. Do the number of products sold perfectly correlate with the financial result?
🕳️ Completeness: There's no gap or missing data. Are there any timeframes where no data is recorded?
🔍 Consistency: Data is in the proper format. Does any data deviate from the defined model or schema?
⏱️ Timeliness: Data is available at the required point in time. When generating a daily report, is all the data ready and taken into account?
✅ Validity: Data is coherent across all the systems. Is all customer contact information always related to an existing user?
❄️ Uniqueness/integrity: The value of the data is consistent across all systems. Are any users' emails different between different data warehouses?
So, what end goal should you be looking for? What’s the outcome of a successful DataOps initiative? Ideally, you’ll rethink how your data teams work with the end-user (data consumer) and build automation to minimize errors and enhance your overall product quality. 🤌
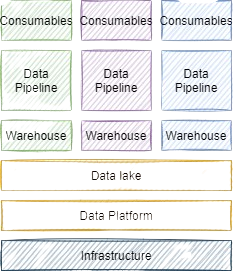
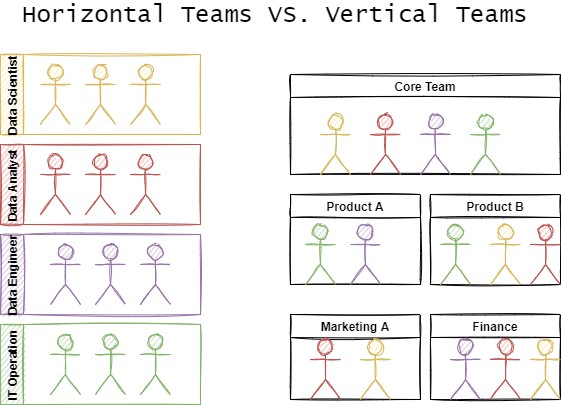
The structure of the modern DataOps stack is actually pretty similar to the traditional DevOps infrastructure. You use the same foundation offered by cloud providers, but on top, you build or operate a data platform. This data platform is used to create a data lake, providing the shared capability to handle data, while the infrastructure is segmented to create a lakehouse for vertical teams.
Here, each team owns its warehouse, data pipeline, and consumables (like reports, visualizations, applications, and so forth) and shares a common goal: To create reusable components so teams can share with and benefit from one another.
Key similarities of DevOps and DataOps
We’ve said this before, but we’ll say it again – both DevOps and DataOps aim for the fast and reliable delivery of high-quality code, processes, and data to the business. They also share views on what company culture should look like, aiming to break down silos, optimize your operations, and harmonize your teams. So, it makes sense that both approaches foster collaboration between people with different skill sets to make one big, happy family.
DevOps and DataOps also follow the same lean principles, focusing on continuous improvement, customer needs (value), identification and elimination of waste, and process simplification and standardization.
Because they satisfy the same principles, it makes sense that both frameworks are structured similarly, enabling small, self-sufficient data teams to provide properly-formatted data for easy end-user consumption. Those teams work on business verticals, so they focus on a specific type of product, marketing strategy, or set of financial questions to keep the automation foundation parallel:
- Manage everything as code: Infrastructure, configuration, and pipelines
- Decouple, componentize, and share your code
- Build tests and validations at every step
Finally, and arguably most importantly, both DevOps and DataOps require a complete, organization-wide revamp of the traditional mindset. That’s not as easy as it sounds, so to achieve that change in a way that sticks, teams must be well-educated. This total mindset shift has to be reinforced by emphasizing the importance of the frameworks: Automate for others to reuse and share. Improving the automation of deployments, integration, and data workflows mean that both frameworks enhance efficiency and organizational alignment.
Key differences between DevOps and DataOps
You didn’t think we’d just compare the two frameworks and leave it at that, did you? We're just getting to the good stuff.
In the simplest terms, DevOps handles code and DataOps handles data. Yes, automation is at the heart of both, but these distinctions translate into significant differences as we move through the automation pipeline.
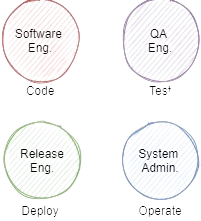
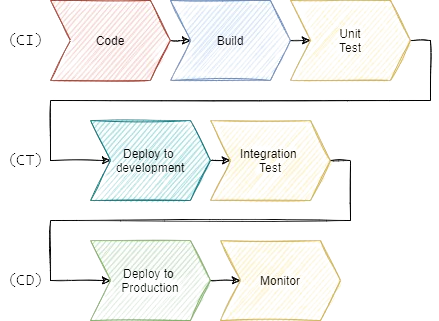
Let’s break it down: The classic DevOps pipeline starts with orchestration, compiling, and unit-testing code in a process known as continuous integration (CI), before being deployed to a development environment and validated against several layers of tests in the continuous testing (CT) stage. In the last stage, continuous delivery (CD), the application is deployed to the production environment and closely monitored.
In a mature DevOps pipeline, all these steps are executed without any human intervention or impact on the production environment. Teams simply focus on delivering what has the most bang for the organization’s buck (i.e. code, test case, and configurations).
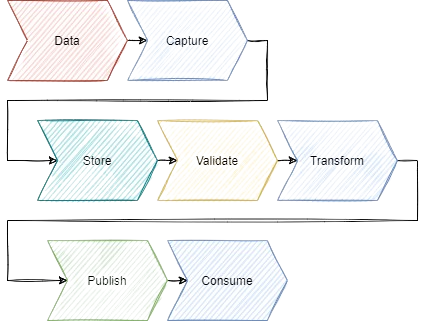
The DataOps pipeline, however, is completely different. The first part of the pipeline consists of capturing and storing the data which is easily complicated. The major challenge is that data can come from many different sources with many different formats, unlike code, which tends to be stored in a Git repository with a predefined folder structure.
Once the data is stored, the DataOps pipeline validates the data to ensure its quality and, much like unit and integration tests, the validation steps entirely block the progression of the pipeline when it fails, ensuring that no dirty data moves to the next stage. Once it's confirmed that the “right data” is being used, it’s transformed and published to the data warehouse for simple consumption.
There’s a clear DevOps-DataOps pipeline divergence, causing different stakeholders to be affected in practicing organizations. You guessed it: DevOps practices primarily impact software engineers, while DataOps primarily impact data engineers and data scientists.
The DevOps field has the most tools and research to support the lean approach, but data is far more complex. There’s still tons of work to be done in DataOps to figure out the best tools and practices to help companies squeeze every last drop of usefulness out of their data. 💧
Lessons to take from DevOps into DataOps
Okay, so let's recap. DevOps and DataOps share some of the same core principles: Continuous improvement, customer-first mentality, identification and elimination of waste, and process-focused simplification and standardization.
From there, the two frameworks go their separate ways, starting with compiling their research and implementing their pipelines differently.
DevOps reaches for sustainability and scalability—everything that can be automated, is. In fact, an entire ecosystem of tools has grown around the practice of streamlining DevOps.
DataOps, on the other hand, is a younger philosophy, and in many ways still evolving. Because best practices and tools are still growing, heads of data and data engineers would do well to copy a couple of pages from DevOps and paste them into their roadmap for pursuing DataOps:
And most importantly,
DevOps is all about producing an application or product that serves the end user well – and all automation is toward that end. As you embark on your journey towards DataOps and truly operationalizing all the information you're collecting, remember what your business needs the data to do and to who it needs to be available. Those details are your secret weapon; use them to help guide you toward the tools and the processes you need to nourish.
Want to kick off Operational Analytics at your company or need help with a use case that’s a little complex? Sign up for a Demo of Census today and our team of experts will walk you through each step of your DataOps journey. Or, if you're looking for support from your peers (and want to find some friends to commiserate with), check out our dedicated practitioners’ community, The Operational Analytics Club. ✨