


Operational analytics is a type of analytics that informs day-to-day decisions with the goal of improving the efficiency and effectiveness of your organization’s operations. Now, that’s a fairly boring definition for an idea that I sincerely believe has the potential to change how organizations use data.
Instead of using dashboards or reports to understand your data, operational analytics drives action by automatically delivering real-time data to the exact place it’ll be most useful, no matter where that is in your organization.
And when implemented well, this flow of real-time data (from data warehouses to people who can actually do something with that data) becomes an undercurrent of insights powering important daily decisions, both big and small.
Here’s a quick thought experiment. What if you could do the following?
- Prioritize support tickets by product usage
- Use sales outreach data to segment audiences for marketing email drip campaigns
- Plug early churn indicators right into your customer relationship management platform
I could go on (and I just might, if you want to hop on a call), but the point is that operational analytics can make all of what I just listed happen automatically behind the scenes. When it’s time to resolve a support ticket, create an email list, or give a customer a call, team members can jump right into action without having to mess with emails, dashboards, reports, or spreadsheets.
At its core, operational analytics is about putting an organization’s data to work so everyone can make smart decisions about your business. You might’ve heard such a promise before from other technologies or platforms, but operational analytics is the only way to accomplish this at scale, because it introduces a set of fundamentals for leveraging data across your organization.
Put simply, if you want data-driven decision-making at scale, operational analytics is the way.

Traditional Analytics vs. Operational Analytics
Traditional analytics uses data to understand business operations, while operational analytics uses data to drive business operations. This difference may seem subtle at first glance, but it cuts deep into the role data plays within your company.
I’m defining traditional analytics here as the data presented via business intelligence (BI) dashboards and static reports created at a regular cadence (weekly/monthly/quarterly). Broadly speaking, the job of traditional analytics is to use data to provide an understanding of what’s going on in your business to inform strategic decisions over time.
The types of questions traditional analytics answers are along the lines of “Is this product line generating revenue?”
Operational analytics is a flow of data from your data warehouse into other tools, like Zendesk, Hubspot or Intercom. The job of operational analytics is to inform specific activities inside your company, whether that's sales, marketing, support, or customer success.
The types of questions operational analytics answers are something like “Which support ticket should I tackle first?”
The difference is in what you use the data to achieve. Traditional analytics looks at data over time to inform long-term strategy; operational analytics looks at data in the moment to inform strategic action.
A Specific Example of Traditional Analytics vs. Operational Analytics
Let’s take a customer success (CS) team at a growing startup as an example. This team would use traditional analytics to measure performance and plan ahead while using operational analytics to get stuff done.
A CS director might need a BI dashboard to track how long it would take to resolve support tickets on average. Ticket resolution time is a good metric for measuring past performance while providing a rough indication of future CS team workload. These insights can inform staffing decisions or changes in CS team processes, but they won’t help individual CS reps resolve more tickets in the next hour.
To resolve more tickets in the next hour, a CS rep might need help with support ticket prioritization. Operational analytics can pull customer information into each support ticket and automatically prioritize them based on a few key characteristics, like if the customer is part of a VIP program, if they’ve shown risk of churn, or if they might be open to an upsell.
For the CS rep, this might look like a few more fields plugged into each support ticket, while the list of tickets overall is automatically ranked by importance. As they settle in over their morning coffee, the CS rep doesn’t have to think through “Which ticket should I tackle first?” Operational analytics answers this question for them, so they can take action.
Over time, the performance of your CS team will improve, leading to higher retention, less churn, and more satisfied customers overall — all because each CS rep will know which support ticket to tackle first in order to have the most impact on your business’s bottom line.
If you empower every team in a similar way as this CS team example, you can start to see the overall impact operational analytics can have. It makes every decision made by each individual a strategic choice that’s backed by real-time data.
How Operational Analytics Works
There is a kind of new standard data stack that has emerged in the last few years, centered on a data warehouse that can support both traditional and operational analytics. If you invest in this core infrastructure, implementing operational analytics becomes fairly attainable for businesses of just about any size.
The modern data stack is made up of four sections: data integration, data storage, data modeling, and data activation.
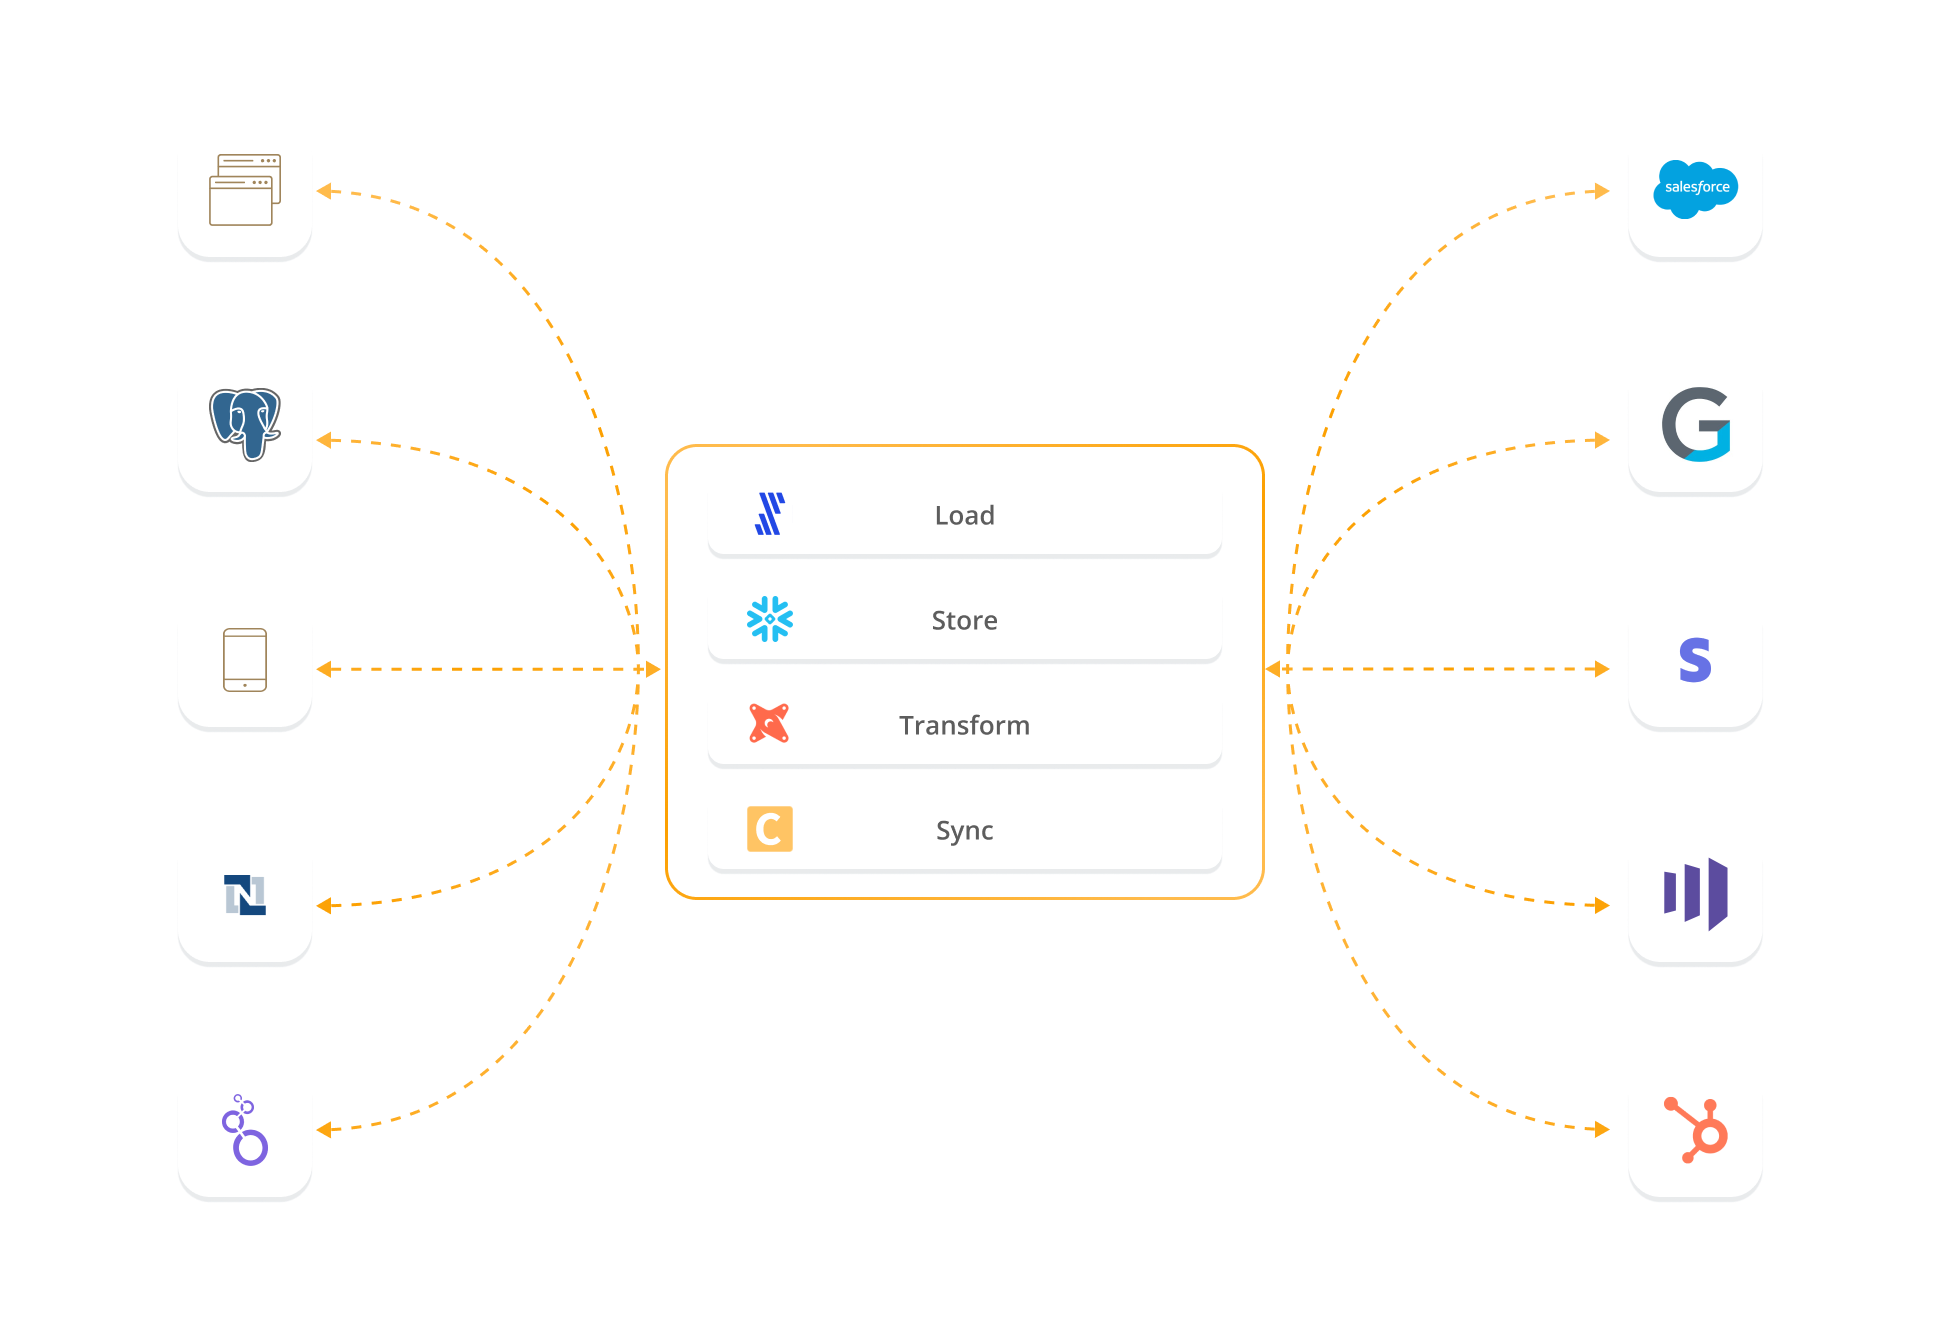
A simple data stack might have the following tools filling out each of these four sections:
- Data Integration: Fivetran, an ETL (extract, load, transform) tool, will integrate all your data sources into your data warehouse.
- Data Storage: Snowflake, a data warehouse, can store structured and unstructured data all in one place.
- Data Modeling: dbt, a data modeling tool, helps you manage your data with a library of data models, which will make your data usable for different purposes.
- Data Activation: Census (that’s us!), a data automation tool, will pull your usable data out of your data warehouse, validate it automatically, and send it to the tools that need it (like our CS rep’s CRM).
A conceptual way to think of this data stack is as a hub and spoke, where Snowflake serves as a “hub” for all data. From this hub extends “spokes,” which are places that data comes from and places that data goes to (e.g., CRMs, marketing automation platforms, a/b testing software).
It’s the job of Fivetran to move data from the spokes into Snowflake. Once the data is in Snowflake, dbt helps make all that data ready for use. Then, Census moves the prepared data from Snowflake to the spokes it needs to go to.
Traditional analytics sends data out of your data warehouse for very specific tools, like a BI platform. Operational analytics sends data out of your data warehouse to just about whichever spoke needs it. They’re essentially different types of spokes that extend out of a single source of truth: your data warehouse.
None of the tools listed here will break the bank (although Snowflake can get expensive if you’re not careful). And they’re easy to set up — Seth Rosen proved it can be done in around 40 minutes — and modular, so if you need to swap them out for another tool you can. The point is that this data stack’s barrier for entry is fairly low.
Why You Should Use Operational Analytics
Any company with more than a handful of customers will likely need operational analytics. Once you reach a point of having a few customers’ data flowing into your data warehouse, you’ll quickly find the limitations of the individual tools you’re currently using. Operational analytics not only provides a way to overcome these limitations at scale but also allows your data team to step up and take a more proactive role in how your business uses data.
Without operational analytics, you have to rely on the analytics capabilities of your individual tools (aka spokes, as we outlined above). There are two types of limitations this places on your team’s capabilities:
- You’re limited by the data you have in that system. If you’re running a complex email drip campaign in Marketo, you need to segment your audiences using Marketo.
- You have to connect the dots on your own. Say you need to call a customer to prevent churn because they haven’t used your product in a while. First, you need to identify that they’re not using your product in your product analytics tool, and then you need to convey that message to your CS team so they can make the call.
Companies will often use spreadsheets as a work-around. Which can work well, up to a point. But once you start dealing with any sort of scale (think 5-10 customers), the data quickly outgrows the capabilities of a Google Sheets doc and some filtering.
Even worse, you’re relying on overworked operations people to manage how those tools work together. There’s a marketing operations person wrestling with Marketo day in and day out, managing these audiences and lists manually. There are CS reps swapping between dashboards, email, the help desk, and spreadsheets, trying to prioritize what to do next.
With operational analytics, you can automate all of these daily brain-draining tasks so these employees can actually start doing their work.
Marketo can now include ad campaign and sales outreach data to help your marketing ops person create hyper-specific drip campaigns, all within Marketo. The CS team can know, without any extra work on their part, which customers are at risk of churn by importing product-usage data — all without wading through miles of spreadsheets or relying on traditional analytics that are just not suited for these types of use cases. The data is just there.
The “X factor” making all of this possible is the data team. Your data team can talk to the marketing team to learn what data they need to run better email campaigns. Then, they use the data stack we outlined above to get the exact data that’s needed to the marketing ops person.
This is a much more proactive role that data teams are just now starting to grow into. These new data teams, powered by a powerful data stack, can diagnose workflow problems and create solutions using operational analytics. In other words, with operational analytics, data teams can become active participants in the success of your business.
Where to Go From Here
There is no reason to wait around if you’re ready to start implementing operational analytics. It’s not particularly difficult, but it does take some consideration.
To start off, you’ll need to start building a data stack blueprint we described above, starting with an ETL tool, a data warehouse, dbt, and Census. You may find you need more tools as you grow, but this initial foundation can take you pretty far.Once your technology is in place, start small with one use case, like helping CS reps prioritize support tickets. Work out the kinks, and begin the rollout to other teams. This process will require some give-and-take between your data team and your stakeholders, but the process will be stronger for it.
We’ll be following up with more articles that go deeper into the nitty-gritty of how to implement operational analytics and what the advent of operational analytics means for the data industry as a whole. In the meantime, we’d love to hop on a call and discuss your options.
Schedule a Census demo today and we’ll get your operational analytics journey rolling.