


Companies have put data front and center more than ever, and we've seen massive shifts in how they've started to treat data as a result. As data usage continues to evolve, a whole new set of conversations in the data ecosystem have sprung up, too.
At Census, we work with many of these data-driven companies on a daily basis to help them transform their DataOps and better leverage data best practices across the modern data stack. In an effort to make the second-hand-gold of these companies more accessible, we set out to bring lessons learned to the wider data community in April at our first Operational Analytics Conference (hosted on Clubhouse).
Our Operational Analytics Conference created space for open mic, personal, and unscripted conversations with data pioneers and leading practitioners. Some of my favorite topics covered:
- Data-related lessons learned
- The evolution of data across teams
- Processes and company culture
- Career advice (and much more)
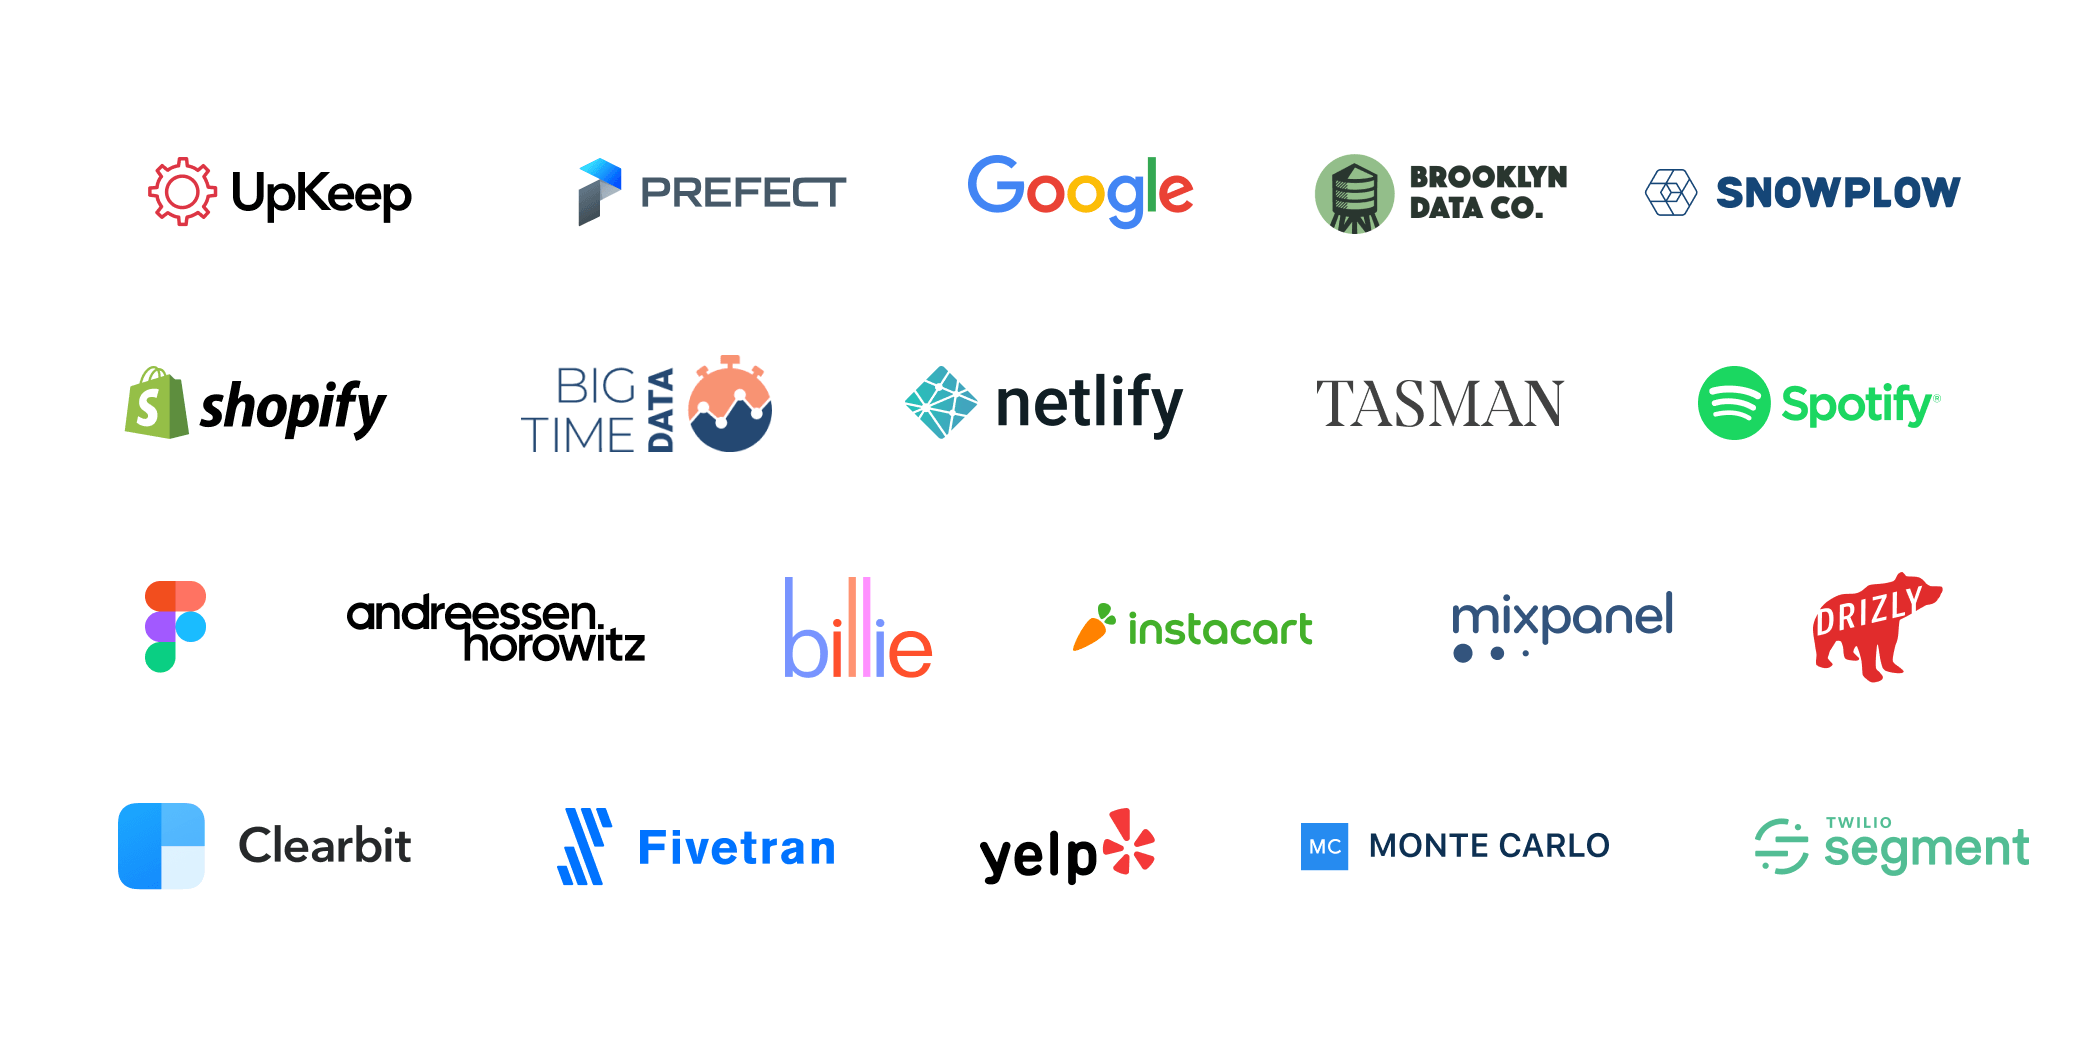
Across six data talks, we brought together a star-studded panel of approximately 30 speakers. These data experts came from leading companies such as Fivetran, Andreessen Horowitz, Google, Shopify, and more. Check out the logos below for a full picture of our attendees.
We've spent a lot of time recapping those talks in the last few weeks, but we wanted to take a beat and give you all some insight into the lessons we learned from sharing the lessons learned by our community and customers (lesson-ception, if you will).
Here, we'll get into how the virtual-conference sausage was made. We've learned a lot (both on the operational side and topical side) along the way to our first conference, and we look forward to rolling these findings into future Census events.
Now, let's dive in. 🌊
Lessons in conference operations
Testing a new type of event platform for this conference meant rethinking our strategy around community engagement and how we measured audience engagement. We learned that we needed to find creative ways to ensure that the conference content could reach the entire data community, as well as re-think what meaningful audience engagement meant for us.
1. A new platform calls for a new community engagement strategy
As one of the newest event and media platforms on the block, Clubhouse posed some interesting challenges to community engagement for our first event. We wanted to try out this new format but needed to figure out how to reach our intended audience without leaving community segments out.
Clubhouse has generated a lot of buzz, but large chunks of the data community weren't on the invite-only platform, either because they didn't have an invite yet, or because the app wasn't available to them yet (Clubhouse was iOS only at the time, and is still audio only).
While we believed (and still do) that Clubhouse offered a unique platform that disrupted the near-universal Zoom fatigue of folks tuning in, we needed a plan to extend the reach of the conference content beyond Clubhouse to anyone who wanted to see the event. We broke challenges facing our strategy down into two parts:
- Getting hundreds of people into an invite-only app
- Extending our conference content beyond Clubhouse for non-iOS users
Getting hundreds of people into an invite-only app. In the first 24 hours after conference registration launched, we received 100 requests from registrants looking for invites. Originally, we were going to try and source invites from our Census team members, but that didn't scale. ☹️
Thankfully, we were able to get help from the team at Clubhouse itself to get any member of the data community who wanted an invite to the Operational Analytics Conference in the door.
Extending our reach beyond Clubhouse. This was, honestly, the harder challenge to navigate. We knew we needed to solve it thoughtfully so we weren't boxing any of our awesome community members out (even if they were Android users 🤖). At the time of the conference, it only supported iOS and was audio-only. Beyond that, the peak time for the highest audience engagement was in the evenings after the workday was over (meaning we had to create an event that was interesting enough to get folks to log back on to watch).
To make our content more widely available to the community, we developed a plan to record and transcribe all sessions (available here), and write a series of blog posts synthesizing and highlighting key topics discussed (check them out here).
2. A new platform meant a new method for measuring audience engagement
As marketers, we started to develop goals around the number of registrants and attendees but quickly realized that, since Clubhouse was a new platform, we didn't have historical benchmarks to measure against. So we pivoted to focus less on validation and more on experimentation. We set out to answer one main question: Would a conference on Clubhouse change the type of audience engagement we would have otherwise seen on a more-established event platform?
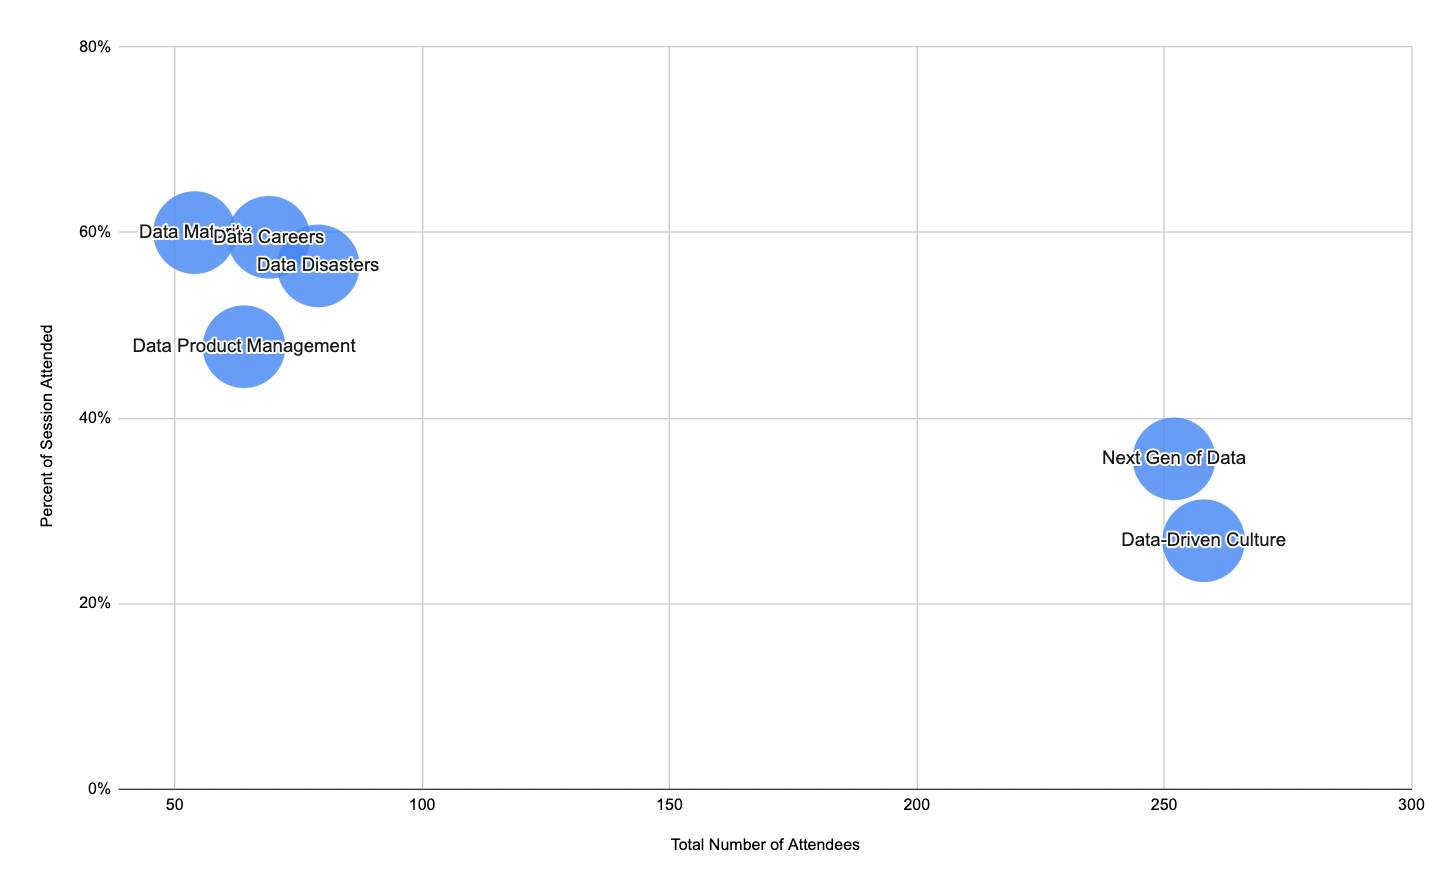
Since the format of Clubhouse rooms is often to drop into "rooms" and stay for only part of the session, we wanted to understand what types of topics led to differences in the number of listeners and how much of the session they stayed for.
We saw a very clear pattern — Sessions that covered a broad range of sub-topics (e.g., next generation of data, data-driven culture) had the highest attendee rates by far (average of 250 people), however, those attendees joined for about one-third of the overall session. On the other end of the spectrum, the sessions covering much more targeted topics (e.g., data product management, careers, data maturity, data disasters) had smaller groups of listeners (67 on average), but they typically joined for more than half of the session.
These learnings have shaped how the Census team thinks about non-traditional events, such as podcasts, going forward.
While this data—and the feedback data we got from our attendees—doesn't just help us improve the operational side of our conferences. Our experts and guests also shared a collection of nights that expanded how we think about data (and the conversation around it).
Topical lessons from our experts and guests
When we filled out our conference scheduling, we aimed to hit on all the major themes of the current data space: data culture, data careers, data disasters, data product management, etc. However, we found that these popular topics were valuable, it was the lesser-discussed perspectives within each that stole the show.
For example, our guest helped uncover some truly shiny nuggets of wisdom, such as the trickiest parts of new category creation, why hiring is the hardest part of data, how data can be weaponized, and more. Here are some of my favorite takeaways.
1. Category creation is like eating glass
We learned from five category creators how they created a product so unique that it sparked a whole new niche. TL;DR - It's messy, difficult, and often uncomfortable.
In fact, it's so uncomfortable that folks often describe category creation as being "like eating glass."
It's "probably the toughest route that you can take as a founder", said Martin Casado of a16z, who has helped dozens of startups create novel product offerings. However, while the beginning of category creation work can feel like eating a bowl of the worst breakfast cereal ever, it shouldn't always feel like that.
Barr Moses, the founder of Monte Carlo, shared that "When I worked on the idea behind Monte Carlo, people would call me before I could call them. When you actually go through those experiences, it becomes pretty clear where there's pull and where you're just eating glass all the way".
Learn more from the creators of Monte Carlo, Prefect, Fivetran and Census here.
2. The hardest part of data isn't code, it's hiring
Demand for data specialists has exploded and brought to light a commonly asked, but difficult to answer, question: How do you build data teams, especially with new graduates or junior individuals?
The consensus across data leaders from companies such as Netlify, Spotify, and Big Time Data was to look for soft skills and teach technical skills along the way.
Candidates with pivotal soft skills often bring the superpower of deeply understanding business needs and collaborating well with stakeholders, which companies struggle to teach well. As a result, some of the successful places to look for strong data hires include career switchers and former teachers. Read more about perspectives on this topic here.
3. No matter how much you succeed, you'll still make mistakes
Segment's lead data scientist, Brooks Taylor, shared that he feels he's making more mistakes as he goes along. While Brooks offers the disclaimer that this "may not be how learning is supposed to work," it's an integral part of growing your skillset.
"As you get trusted with more and more things," he said, "you have the opportunity to ruin more and more things."
Wondering what learning-experience mistakes can look like? Check out the story of the missing $5 million in revenue.
4. The weaponization of data
Data-driven culture is the hot topic these days - in fact, it came up in almost every data talk.
Michael Stoppelman, who led engineering at Yelp for 12 years, brought up an all-too-common problem where data-driven decision-making collides with the size and bureaucracy of a big organization.
Max Mullen (co-founder of Instacart) coined this as a "weaponization of data." Companies weaponize data when they use it less to bring to light lessons and opportunities for growth, and more as a lever to shore up internal politics and ego in the organization (aka the dark side of data).
Jeff Ignacio from UpKeep shared a very common example of the credibility exercise happening when different people in the room define key business metrics differently or use data points to prove their perspective. Read about the dark side of data.
Feeling some FOMO?
If you want to relive the live discussions (or catch up on sessions you missed), you can find all the recordings and transcriptions here. If you're pressed for time, check out recaps of all sessions from the Operational Analytics Conference on the Census blog, including:
- 5 Data Leaders on Category Creation
- Data Maturity: When to Switch Processes and Tool Stacks
- Data Product Management
- Data Careers: Building and Leading Modern Data Teams
- Data Disasters: The Untold Stories
- How Do You Build a Data Driven Culture?
- Cambrian Explosion or Consolidation? Where is Data Right Now
This Operational Analytics Conference is only the beginning of data events for Census. Stay up to date on future events here.