


Most sales and marketing teams come together for one unified purpose: To increase revenue with lead generation and conversion. But, if you’ve been around the block a time or two, you know not all leads convert into paying customers. And, more importantly, you recognize that it’s not really singular leads that are the end goal, but the overarching companies they work for.
So that begs the question: How do you identify which accounts your sales team should target from the sea of leads? 🌊 Cue account scoring.
What is account scoring? Account Scoring is one of the most powerful analytics concepts in B2B business in recent years. It helps you determine the level of engagement of each of your accounts, sorting your prospects from most to least valuable. This allows you to understand each account’s overall company health, what accounts the sales team should prioritize, and how customers are adopting your product.
At its core, it consists of a few simple parts: A stream of activities, a scoring mechanism to assign a value, and a strong understanding of your ideal customer profile. In this article, we’ll cover how to build those individual components and different use cases for account scoring throughout the organization.
Lead scoring, account scoring… What’s the difference?
The concept is fairly simple to start – all you need is a few internal tools and some creative work with your data warehouse. If you’re familiar with lead scoring, then you’re already halfway to understanding account scoring. 🙌 The major difference is that lead scoring involves assigning points to certain activities that a person does during an interaction with your brand (like pageviews, form submissions, webinar attendance, event attendance, etc.), while account scoring rolls those activities up to an account level.
Why should you care about selling to accounts instead of individuals? Because even though individuals are signing for your product, the company is ultimately the buyer, adding in multiple people that need convincing before signing on the dotted line. 🖋️ Essentially, account scoring allows you to hone in on which companies your sales team should be focusing on, so you can take an account-based marketing (ABM) approach and concentrate your resources on that set of qualified accounts with tailored campaigns and messaging.
Today, account scoring is especially helpful when dealing with the complex B2B sales process. Along with sales and marketing, account scoring can be an extremely powerful asset in the product and customer health world.
Generally, it will sit in one specific department like Marketing Ops or Sales Ops, but when thinking more holistically, it sits better in a part of the organization that touches all departments. Why? While most account scoring models will solve the problems of its parent department, linking data across multiple departments allows you to solve problems across the business and eliminate bottlenecks.
Solve your toughest business problems 💪
Before you get deeper into actually building an account scoring model, it’s crucial to identify what your top business problems are and understand how looking at your data at an account level will help solve those problems. For the most part, you can split these into two categories: Customer-related problems and prospect-related problems.
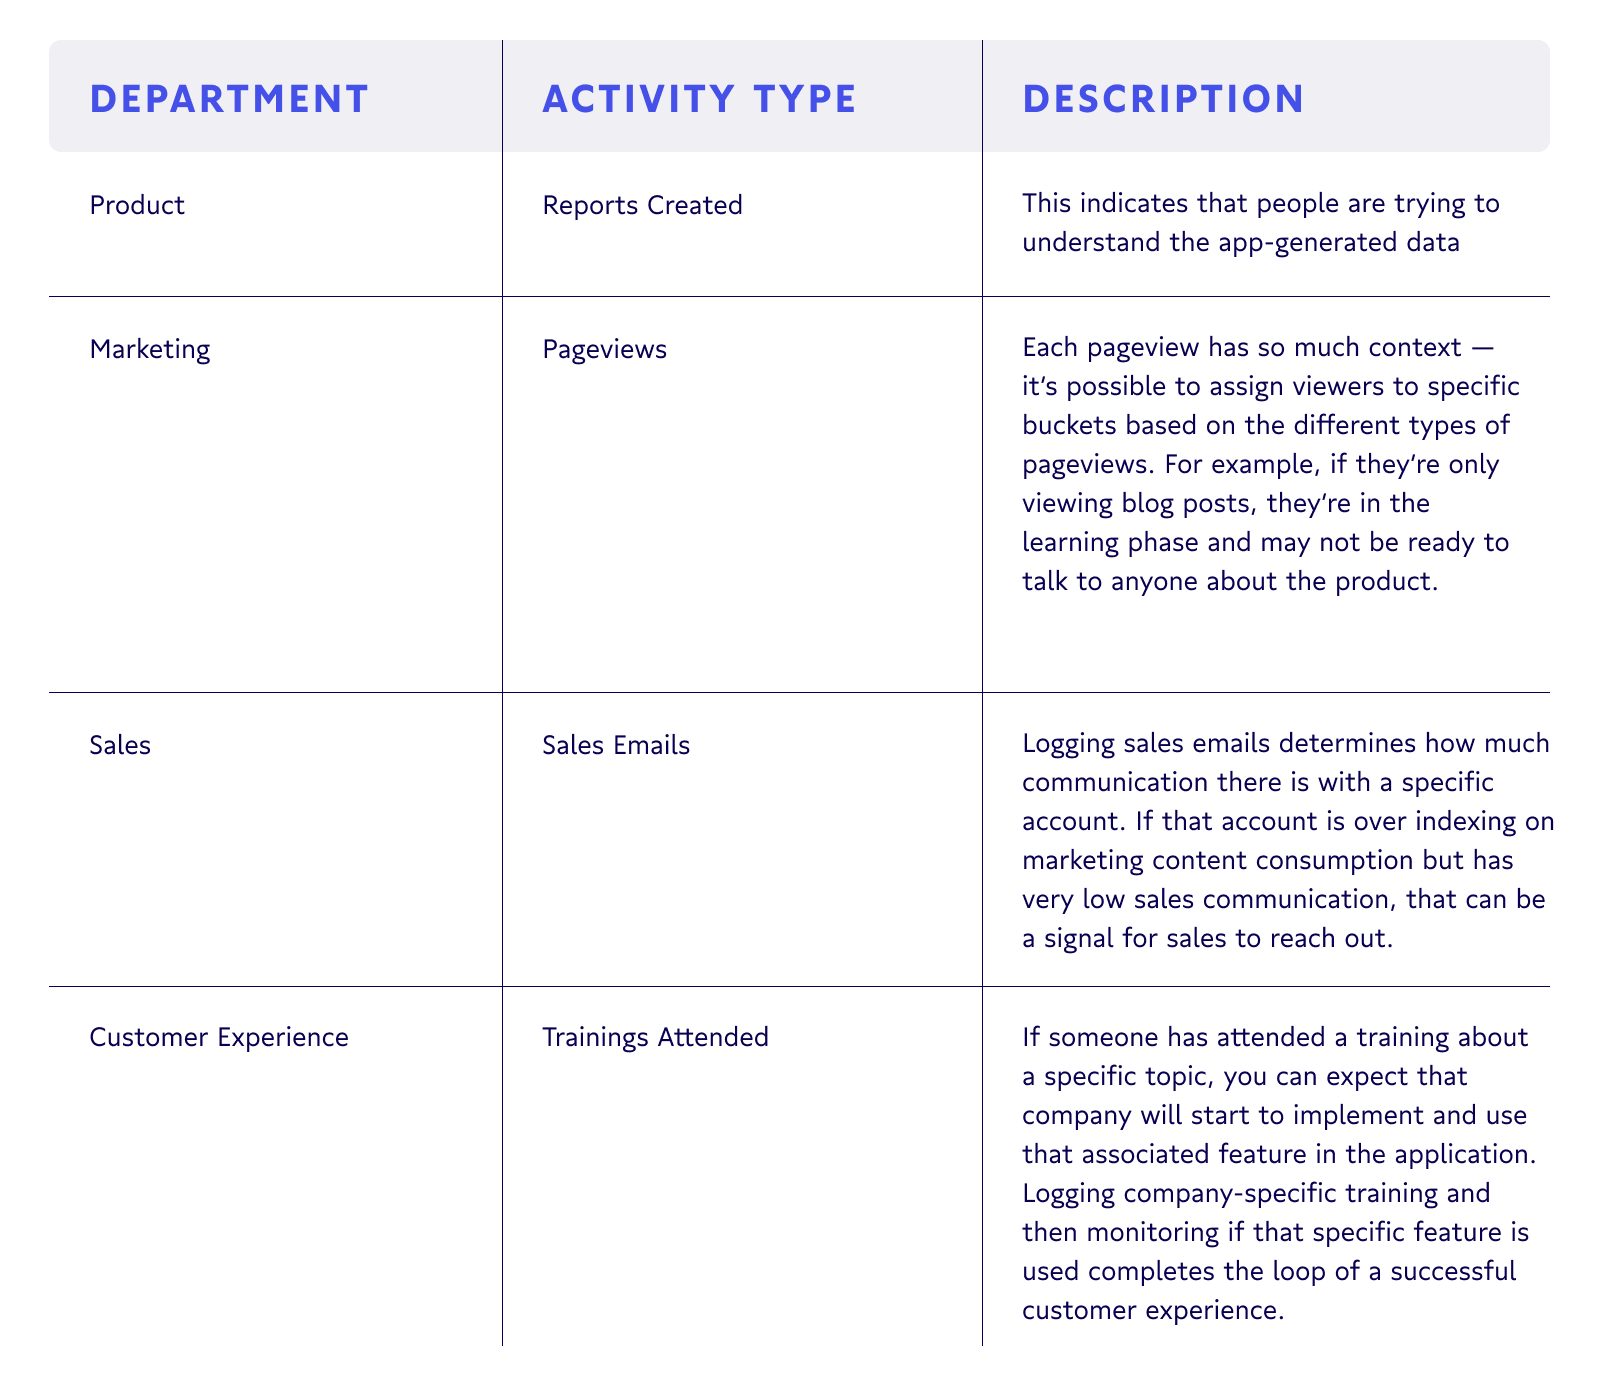
These two areas cover all your business units, including sales, marketing, product, and customer success. Here are some indications that you might need account-level info. 👇
- If you knew an account was interacting with a lot of marketing content but has had little sales communication.
- This would signify that sales should reach out. After all, a healthy account will have a clear connection between marketing collateral interaction and sales communication.
- If you’re monitoring the company training and documentation sites.
- If a user or account has consumed content on a specific feature, you should expect that account to use that specific feature.

|
When it comes to current customers, account scores can help understand the health of a customer and be used to help prevent churn. Not only does this help you prioritize your accounts, but the data model that powers this can aid attribution and framework development to help you truly understand what causes accounts and people to convert to customers. 🤝
🚂 If your engine is running smoothly, it can do more than just reporting and rank stacking; you can start to use it for automatic communication to kickoff campaigns or product interactions.
Let’s build this thing 🛠️
Now that we’ve established why you need account scoring, let's talk about the basic components you need to build your own account scoring matrix. To start, list out all of the important activities individuals or companies take while using your product or interacting with your sales and marketing collateral.
For example, for a SaaS product, you could list out logins, button clicks, dwell time in-app, time spent viewing documentation, or the number of reports that have been run. If you’re in marketing, you could list out pageviews on the main website, form submissions, event attendance, or emails opened. The sales team could list out life cycle stage changes, emails opened, meetings set up, and any opportunity stage changes, while customer success could log communication emails, training attended, forum posts, support tickets, or time spent viewing documentation.
|
The basic schema I use to collect this data in one table consists of an account ID, a user ID, a timestamp, a few fields describing the activity, and some metadata describing the activity (like page description or marketing channel). An excellent resource to understand how this table function is activityschema.com which details the benefits of modeling your data like this. Some of those include:
- The ability to analyze data across multiple data sources and related activities together
- An understanding of what really drives people through the user journey with activity-based attribution
- Consistent and easy-to-understand events with a single source of truth
☀️ To learn about even more applications and benefits, check out Timo Dechau’s and Donny Flynn’s Talks at Summer Community Days. ☀️
When building your specific activity schemes, these are a few things to keep in mind. 👇
- Activities can be at both an account level and a user level. You may not know which individual did the specific activity, but you identify the account. This could be from data identified by IP address from technologies like Clearbit.
- There’s a chance you can back-propagate data for any data collected from the web. The primary user ID may not be known until the 3rd or 4th event, but the ID from the browser will be. You can self-join the data back to the event set to fill in those previous rows with the browser ID and the primary user ID.
- Metadata will be just as important as the activities themselves. An unknown click on a random button doesn’t mean much, but an email click on a specific marketing email with high intent means a lot. After all, when you understand the content of a click, you can understand the intention of a person.
- Look in interesting places for data like your digital analytics system or webinar system. Anything with a user ID and timestamp can be rolled into an activity stream.
Along with this, there are three other components you’ll need to power a full account scoring system: A user table, an account table, and some type of scoring table. The user table and account table are something you most likely already have; almost every single CRM has these two components. For example, in Hubspot, these will be called Contacts and Companies. In Salesforce, these will be called Contacts and Accounts.
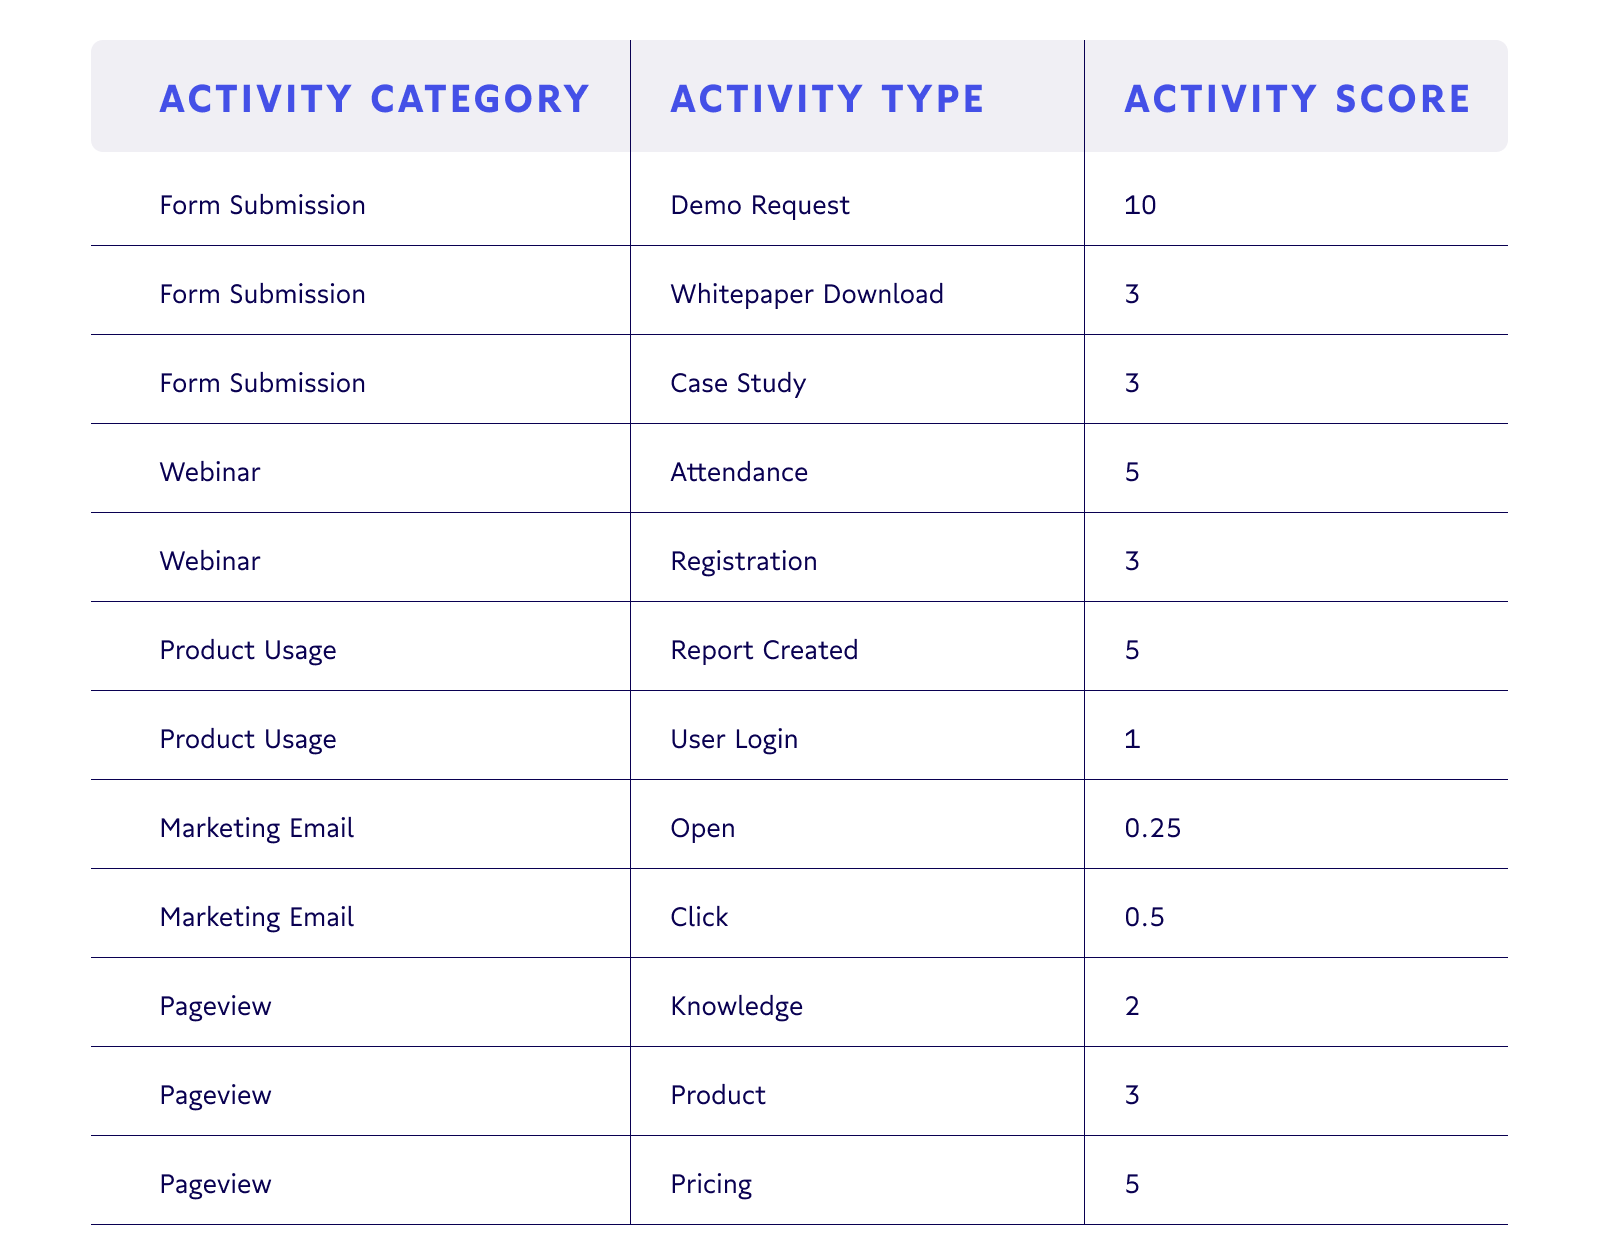
However, the scoring table is something that will need to be created. Start simple and take the list of activities that you created earlier and assign a value to each of those activities.
For example, someone looking at your home page will not have the same meaning as a form submission. This exercise will probably look similar to when your lead scoring was set up: You take a list of activities and assign value based on the intent of it. Trust your “gut instinct” and start assigning scores based on what you already know about the business.
(There are more advanced techniques for setting the scores like logistic regression, but that is a whole article in itself.)
|
Because you have this as a separate table that can be joined onto the activity stream, you can reset the scores at any time if you need to adjust a point value.
Potential Issues
Remember (we’re repeating for emphasis here): As you gather all of this data together, start simple! If you don’t have digital analytics data with user IDs attached, then start with data from your CRM. If you have none of this data, you can use systems like Fivetran and Stich to pull data from your platforms into your warehouse.
Don’t get stuck on assigning point values to activities either; it’s better to have an initial account scoring matrix in place and improve it over time. 🔁 When getting this up and running initially, you might face issues with organization adoption. If data is just sitting in a warehouse – it 👏 will 👏 die. 👏
Your data has to be in the edge system and in front of the user who is consuming it to actually be useful. Then, you can use Census to sync it back to your customer engagement systems like Salesforce, Hubspot, or Zendesk. You’ve probably heard of this as reverse ETL.
Putting it to work with an account-scoring matrix
After you have your scoring table and activity stream together, start aggregating all of that data to an account level and using it. We started with a limited use case, but now would be the time to enable it in other systems.
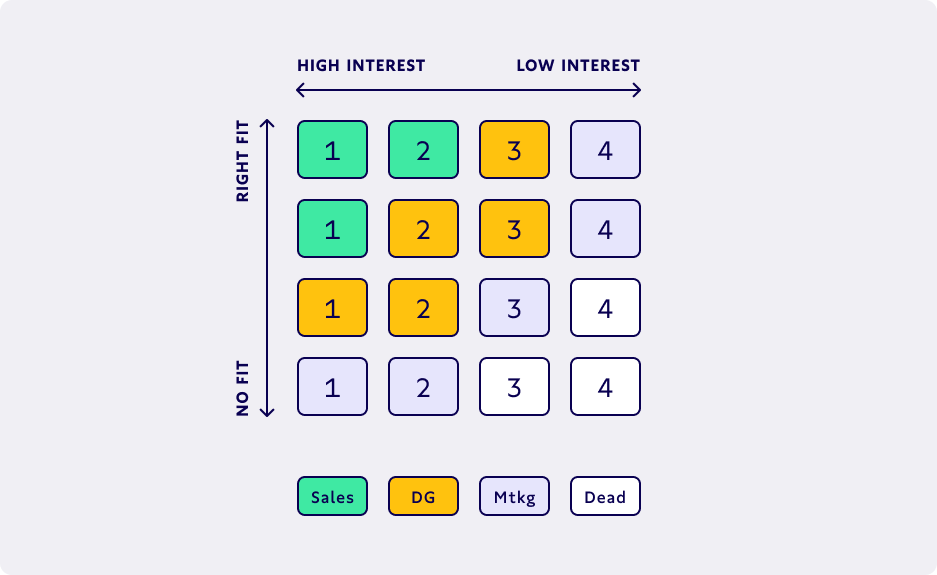
For example, enabling account scoring for the sales organization would roll up all the scores into a single, easy-to-consume score that takes the top 25% of your most active accounts and assigns them a high number. When you take the company fit and pair that with that number, you’ll have a system to help you identify accounts that you want to talk to and that want to talk to you.
|
By understanding the power users' behavior, you can build a better product for those people who love your product. In fact, you can keep an active list of these power users and offer them incentives in the product like more training or beta testing.
👉 For more information on that, check out my Summer Community Days talk on how to turn activity streams into actions.
Plus, pairing this list of these power users with boolean statements and sending that to your communication tools with Census enables all kinds of use cases. 👀
Keep in mind, some factors – like how many users are actually in an account – might affect the overall scoring when comparing accounts next to each other, so it tends to be best to normalize the aggregation by the total number of people that are associated with that account.
This is different from the sales and marketing use case because the number of people interacting with content only helps that account rise in priority. But with product data, the case is the opposite because you’re expecting there to be a certain number of users in that account.
However, these use cases don’t have to be independent. And, when you start to combine different data sources, you can get even more compelling stories. For example, a customer success team knowing what marketing communications have gone out to a company can help prevent them from oversaturating them with more communications, causing them to unsubscribe, or worse, miss important product updates. On the flip side, knowing product usage and who are the power users can help marketing build strong case studies. 💪
Bringing it all full-circle
Needless to say, there are many different directions you can take with account scoring. With almost endless use case opportunities at your fingertips, the most important thing is to start thinking in an account-oriented way. 💭 Once you shift your mindset to the account level, it opens up all kinds of ways of creating concise communication and different analysis to understand how people are interacting with your company and product.
Once you’ve honed in on target accounts, combining that account-level data with Census rETL empowers all your teams. By syncing that information back to your customer engagement systems like Salesforce, Hubspot, or Zendesk, you give every team the data they need to act and automate with confidence.
🤔 Want to see how this works for your use case? Book a demo with a Census product specialist!