


Thanks to the Cambrian explosion of marketing & analytics tools, it has never been easier to track events such as clicks, page views, or any activity in your app. Developers can easily drop in an SDK like Segment to track events and tie them to an identified user.
That means you can have a timeline in your tools that will look a little like this 👇
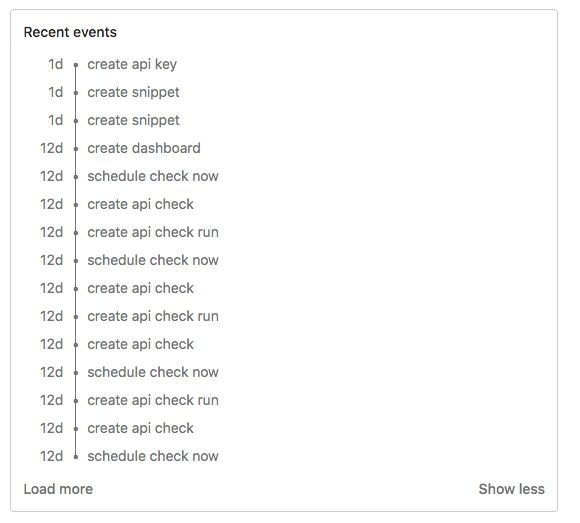
We all feel good looking at this timeline; the problem is that we don’t learn much about our customers when looking at it. The other use case for event data is usually to trigger workflows. For example:
- When a create an app event is triggered, start sending users our nurturing email campaign
- When a user has visited our Enterprise Page, send an alert in our Slack Channel
Or you can create a dynamic list/segment based on that data, such as:
- Users who have triggered the created an app event in the last 30 days
- Users who have visited our Enterprise page this month
That’s all well and good, but it doesn’t get you very far... To really unlock the power of event data, you need to transform them into attributes.
From “meh” Data to Attributes
The real power of event data is when you aggregate or transform them into user or company attributes. For example, take the following event stream for a user of a collaboration tool (e.g. Figma)
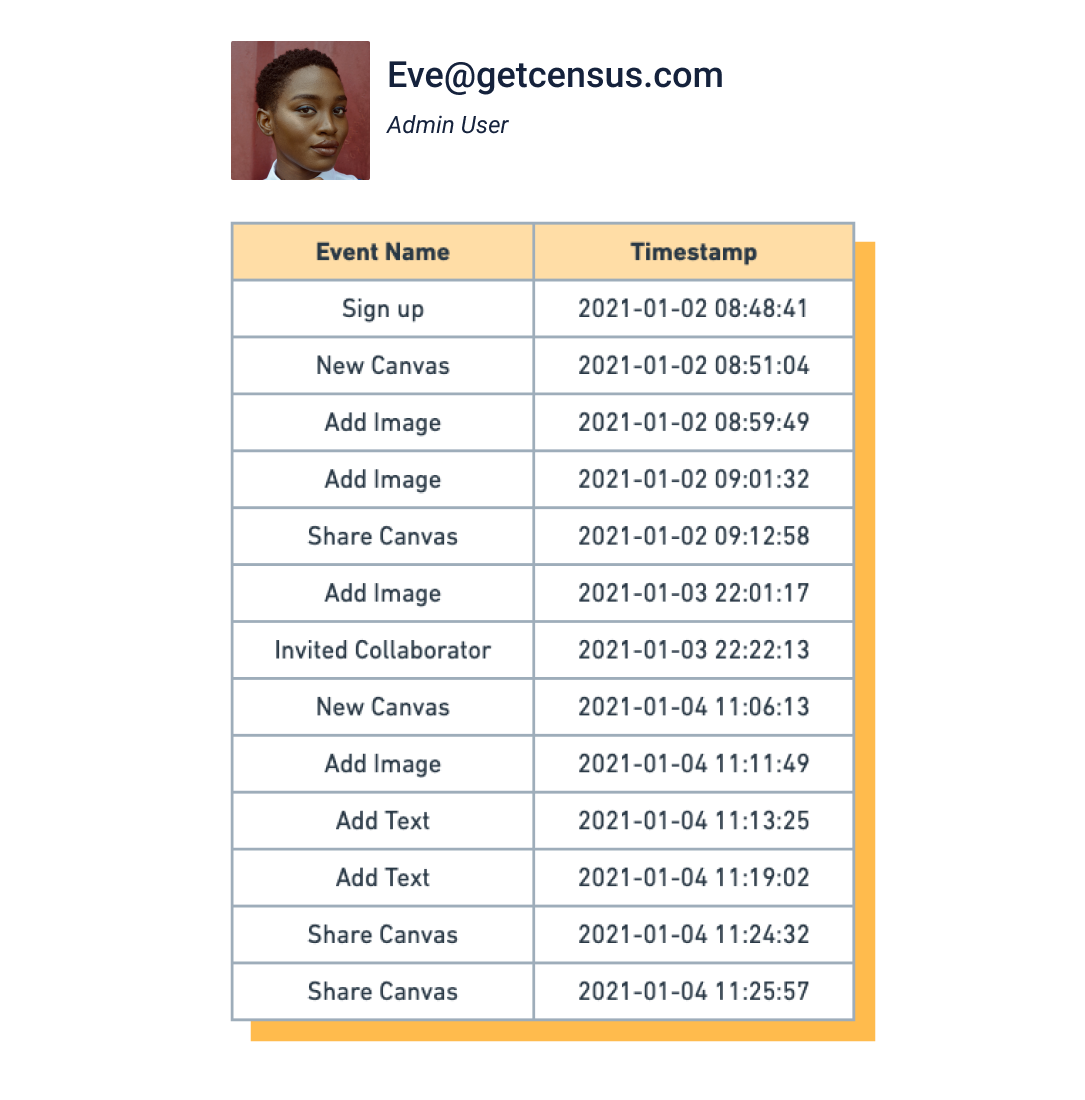
With these events in our email marketing tool, we will welcome this user to our service and add them to our nurturing campaign. Maybe we will even send this user to our Sales CRM as a lead for our Sales team to manually check if they are a good fit for us. Or we will blindly prompt them to invite a collaborator during their 2nd week.
Simple aggregation => Unlock more power
If we take the exact same events and start aggregating and transforming them, we can do much more with this info and enrich our users' profiles. We can create fields such as:
- # of Canvas created in the last 30 days (🤫 We have a whole post on this here)
- # of Canvas shared in the last 30 days
- Total # of collaborators invited
- Last Canvas created at
- Use Image Feature?
- Last Image added at
- Use Text Feature?
- Last Text added at
This simple aggregation of event data unlocks tons of possibilities. Doing this is pretty straightforward with SQL, as it was built precisely for this task. If you have an Events table in your database (Segment can send all of the data to your warehouse for “free”), you can start doing this right now. 💪
Here is a query for our fictional SaaS company to create the canvas_created_last_30_days and use_image_feature? fields
WITH canvas_created AS (
        SELECT
                u.id AS user_id,
                count(*) AS count
        FROM
                events e
                INNER JOIN users u ON u.id = e.user_id
        WHERE
                e.time > CURRENT_DATE - interval '30' day
                AND e.name = 'New Canvas'
        GROUP BY
                u.id
),
as_used_image AS (
        SELECT
                u.id as user_id,
                CASE WHEN max(e.time) IS NOT NULL THEN
                        TRUE
                ELSE
                        FALSE
                END AS "used_image?"
        FROM
                users u
        LEFT JOIN events e ON u.id = e.user_id
                AND e.name LIKE '%Image%'
        GROUP BY
                1
)
SELECT
        u.id,
        u.email,
        cc.count AS "canvas_created_last_30d",
        aui."used_image?"
FROM
        users u
        LEFT JOIN canvas_created cc ON u.id = cc.user_id
        LEFT JOIN as_used_image aui ON u.id = aui.user_id
This query returns a table of users with their aggregated attributes.
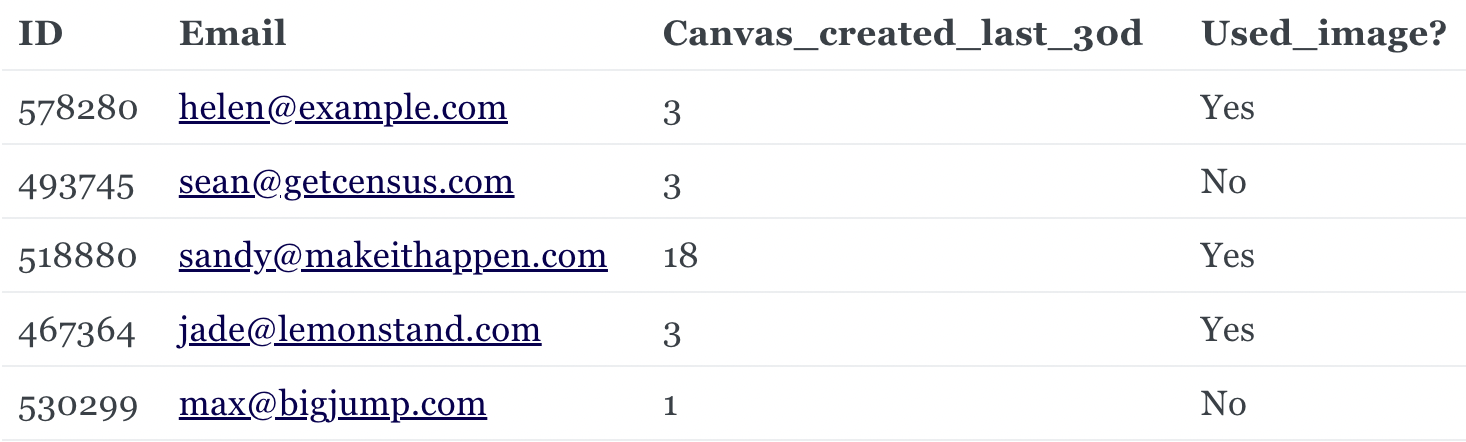
With this aggregated data, we can start segmenting our users. Instead of sending a basic “Welcome to our service” email campaign, we can use our data in new ways:
- Send them a campaign that is more personalized like “Hey, you have been adding images to your canvas, that’s awesome! Did you know you could add text too? check out this tutorial video.”
- Segment these users and start retargeting them on Facebook or Google to promote our Text Feature.
- Reward power users with messages such as “you created 3 canvas in the last 4 days, that’s amazing! Fill in this form to get your free t-shirt.”
- Alert your sales reps that one of their leads are actively using the product when they create 3 new Canvases.
Data Modelling => Super Attributes
That’s all great, but you know what’s even better? Computing brand new metrics based on these dumb events. For example, with the above event stream, you can start calculating new attributes such as:
- Account health score
- Product qualified lead
- Daily Active Users per account
- Monthly Active Users per account
Let’s take the Product Qualified Lead idea. Using our initial event stream, we could say that a qualified user is someone who had significantly engaged with our product, say for example:
- completed the onboarding
- created 3 canvas in one week
- and shared at least one canvas
At this point, they would have used our product enough, and we can start selling them our “Team Plan” to generate more revenue. Again, creating this PQL score attribute in SQL is straight forward (we wrote about this topic previously).
💡 I have events, but they don’t look like the ones you have?
That’s ok. You should create an event tracking plan to enforce a schema. This topic will be the focus of a future post. For now, here are some high-level tips:
- Create an event for any state change in your application: app created, app deleted, feature_X enabled, feature_x disabled, onboarding started, onboarding finished, became paid customer, payment success, payment failed, invoice created, etc... you get the idea. If each event has a timestamp and is tied to an unique_id of a user/account, this will allow you to recreate the state of your objects at any time.
- Create a spreadsheet (or Airtable like the cool kids) where you list for each event, the name, it’s properties, why you are trying it, etc. Iteravility is a product that focus on this (and more) or use one of these free templates.
From Attributes to Actions
Going from event data to attributes, we've already manage to do more things with our data. For example, segmenting users based on aggregate attributes or computed metrics.
Now the next step, as hinted through this post, is to put that data to work in your CRM, Marketing Automation Tools, Service Desk, Sales Engagement.
If we send the event data and new user attributes we created in this post to your tools, you can now unlock possibilities such as:
- Sending qualified leads to your sales teams at the right time, thanks to your PQL Score
- Routing & Prioritizing Support Tickets to the right agents based on the product features the customers are using and their spending level.
- Alerting the Customer Success Manager of an account when the customer's usage drop.
- Showing your Sales, Customer Success, and support teams how the customers are using the product in the tools they use without having 5+ tabs open to get the full picture.
- Sending Personalized Email Campaigns at the right time and to the right users based on how they use (or not) your product
- Creating Hyper-Targeted Campaigns on Facebook/Google/Linkedin to re-active leads, promote your new features (that they are not using yet)
... And that is just using the example event data that we aggregated in a blog post!
What's next?
Transforming event data to object attributes is only scratching the surface of what you can do with your data. If you are looking to do more with it, you should contact us.
We spend our days helping amazing companies like Figma, Notion, Drizly and Clearbit using their data to drive revenue.