


After years of online-only events, 2022 was the first year where we finally got to experience the beauty of in-person events again. 🌤️ And, since this was the first year back in action, you know we had to take advantage of as many events as possible.
From Snowflake Summit in Las Vegas to HubSpot Inbound in Boston, we traveled far and wide to soak up every bit of data knowledge 🧽 – and we’re happy to say that the conferences definitely didn’t disappoint. We laughed, talked nerdy, and learned a lot.
So, naturally, we wanted to capture some of this year’s conference highlights for y’all. Here’s a fun little 2022 conference recap with some of our favorite moments.
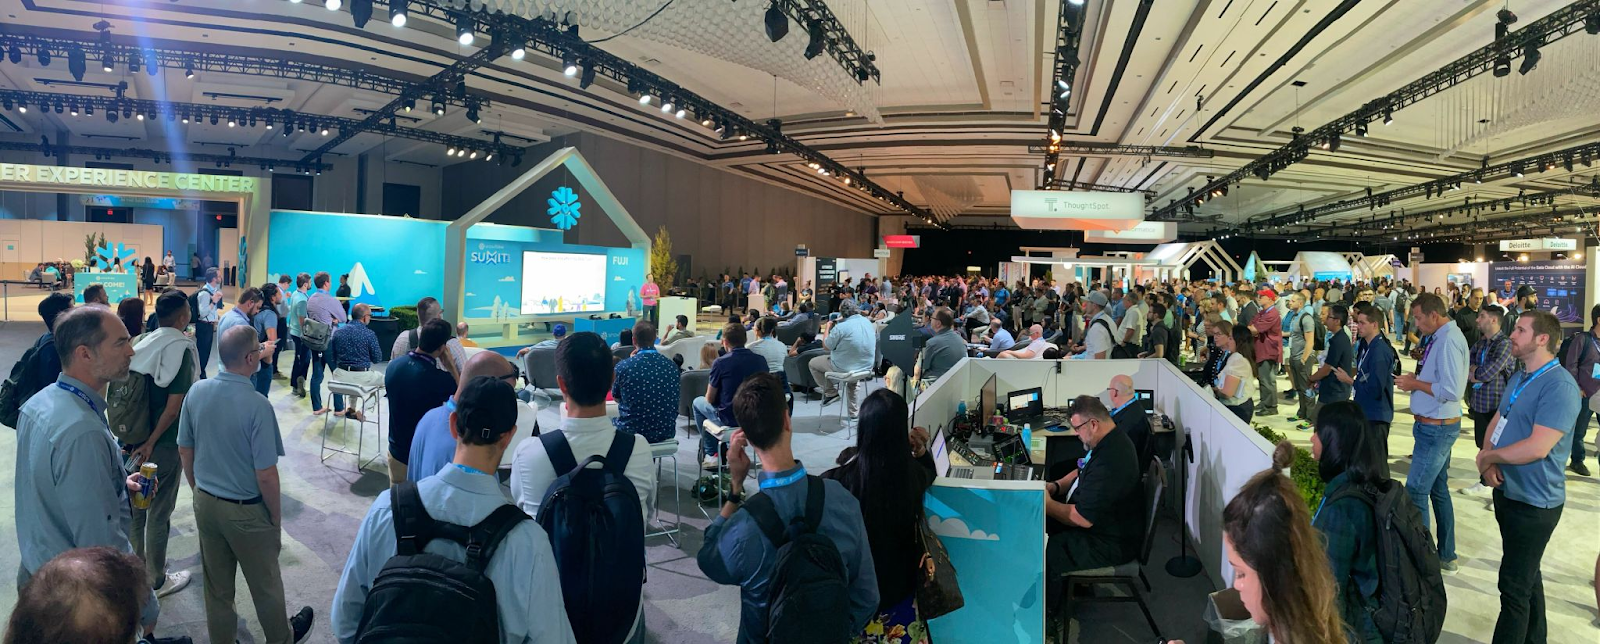
Snowflake Summit in Las Vegas 🎲
Overall, Snowflake Summit was really cool. I mean, who doesn't like hearing about Data Apps while connecting with data folks and friends? The conference featured over 10,000 attendees, 27 sessions, and countless product releases relevant to data professionals.
Unfortunately, a bunch of Census folks were out of commission (thanks, COVID 🙄), so there were fewer flamingos than usual at the event.
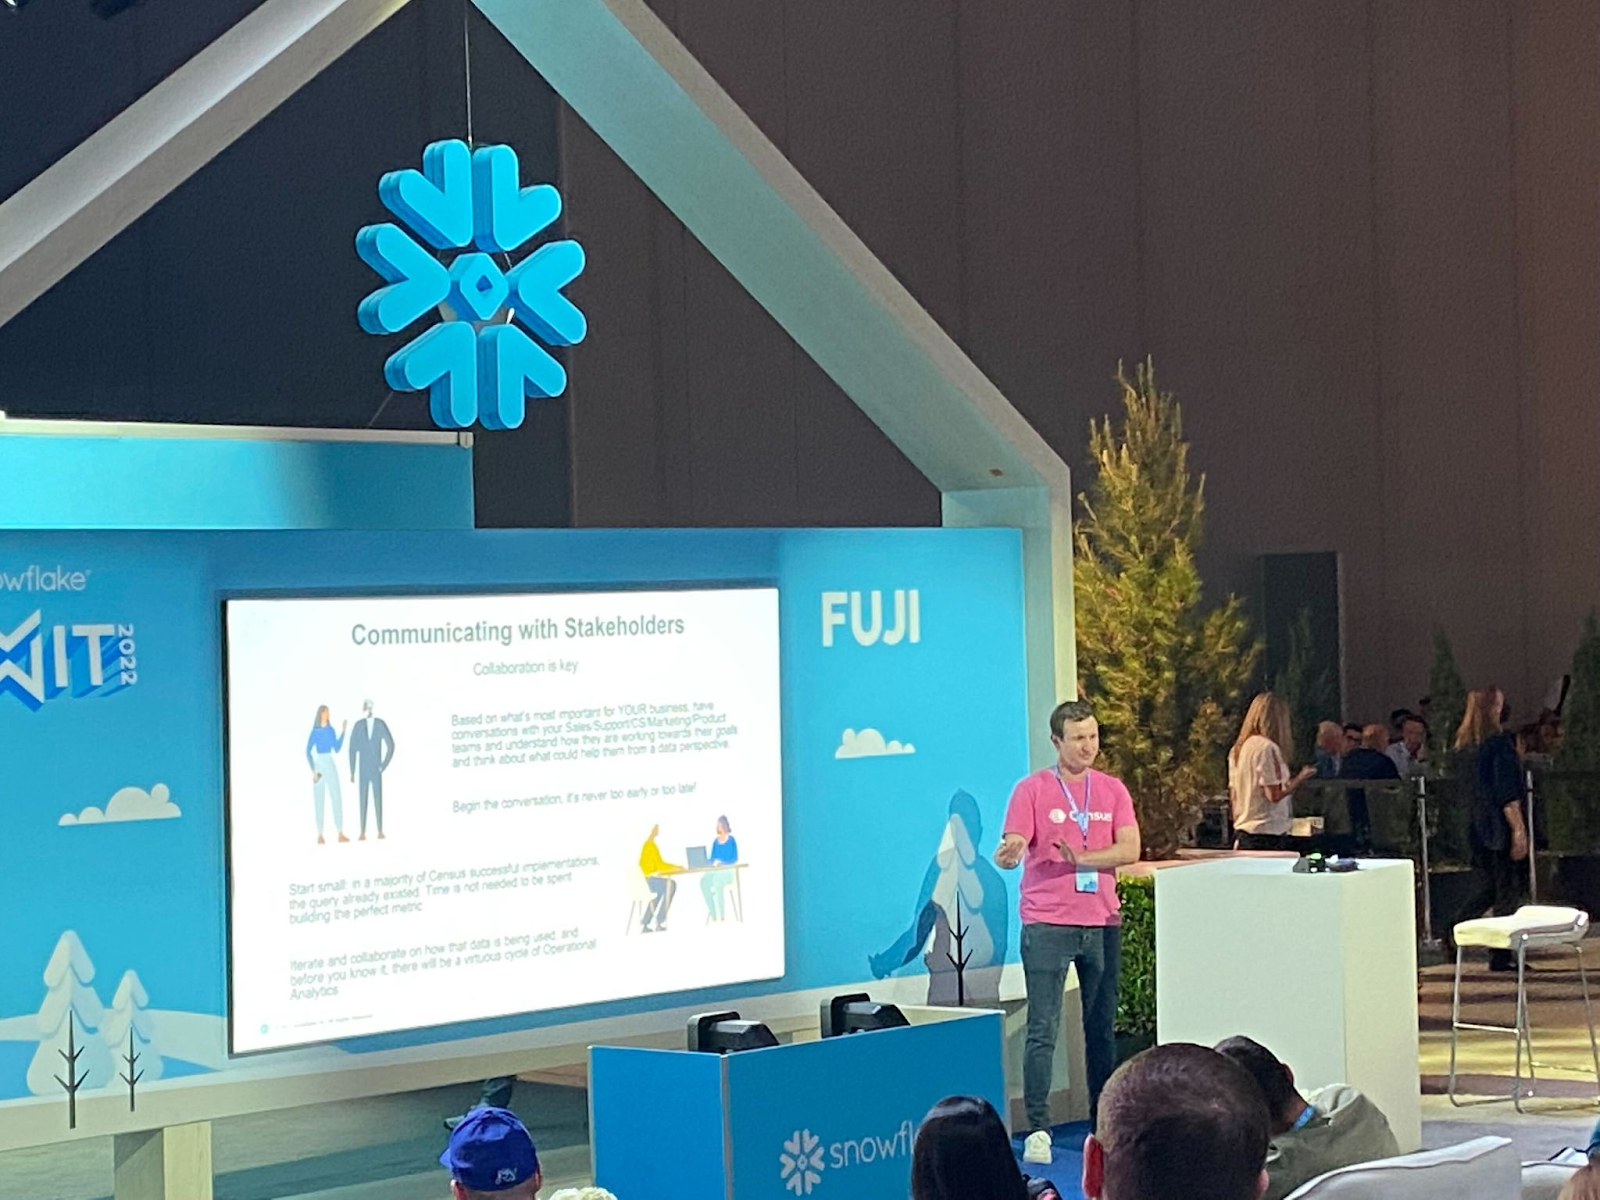
On Wednesday, though, I (Donny) had the awesome opportunity to speak at Mount Fuji (side note: I really liked the mountain puns with the "Summit" 🤭). It was by far the most people that I had spoken in front of in my professional career. In fact, over a hundred people attended my talk, “Nobody wants your dashboards. They want your data.”
With a catchy title in hand, I began in that vein – starting with how and why dashboards fail. TL;DR 👇
- They are outside of the action flow of the business
- They are not inherently iterative
- Self-service dashboards actually lead to problems.
Disclaimer: This was a challenging and exciting opportunity to speak in front of so many people, but it was rewarding to have people that were engaged and excited to hear about how Operational Analytics can help their day-to-day workflows. Very cool to see the head nods in agreement!
So, what’s the solution? Operational Analytics directly addresses all three of these points.
- Where dashboards are a tool to be learned and are outside of the current action flow of business users, Operational Analytics puts those insights into the tools that are being used by business stakeholders: CRMs, customer engagement platforms, support tools, ads tools, etc. And business users already are up to speed on how to use those tools, so there’s no need for team enablement 😄
- With Operational Analytics, the data that is transferred to the business teams happens in a more iterative manner, so you can easily add fields to optimize for the current business use case.
- Operational Analytics leverages the data hub, so data quality and definitions are built-in. There is also alerting and observability for when things fail, and the UI of self-serve becomes the tools that business users are already using.
If you want more deets on this, check out my slides!
The feedback that I received from (and the subsequent conversations with) people that stopped by was very positive! ➕ It turns out that many data analysts and heads of data feel like they create dashboards that aren’t used in business production.
There was much-shared frustration that I felt from people around the way that data is viewed and works with operational stakeholders. Something isn’t working and it was clear that operational analytics presents an interesting opportunity to have a new workflow.
Then, on Wednesday evening, Michael Revelo, David Garrison, and Jessica Larson hosted some data folks at RBAC dat a$$ up. It was an awesome event with an amazing view, and it was refreshing to experience a “data practitioner”-led evening without vendor sponsorship. Plus, it’s always great to meet new peeps. 🙌
📖 Also, Jessica’s book seems awesome - I bought a copy, and it’s next on my list to read.
The final talk I enjoyed was Snowpark Java & Python UDFs DEMO | Under The Hood by Elliott Brossard. If you’re curious about Snowflake user-defined functions and how to use them with Javascript, Python, and SQL, Elliott gives an in-depth workshop on how it works conceptually and in practice.
As a parting observation, something that was very apparent at Snowflake — and as data Twitter noted — Snowflake Summit felt "digital transformation"-heavy and “partner”-led. Deloitte being a premier sponsor was evidence of this, as well as the conversations I overheard from groups milling around the squishy conference floor.
Databricks Data + AI Summit in SF 🌉
Next up (a mere two weeks later) was the Data + AI Summit! For this event, I had to make the long slog over to San Francisco. It was a whole SIX MINUTES away from the Census office. I felt like this guy.
In all seriousness, though, we had much more coverage and more healthy humans on the Census team, so I was able to attend many more talks at this conference. The keynote was awesome, and I took some stream-of-consciousness notes, which I pared down into semi-comprehensible English as follows. 👇
Ali Ghodsi, CEO of Databricks, opened by talking about how a Data Warehouse (DWH) is great for structured data and aggregations, but storage is fairly expensive with regard to the overhead of information. He posited that you shouldn’t park everything in a DWH since the unstructured data support is not great and latency times are high to access them.
Meanwhile, data lakes have low latency and unstructured data support, but it’s very difficult to aggregate data. It needs organizational overhead for it to be performant at all.
These are two incompatible data architectures (well, quite frankly, this should always be use-case driven. If you walk around with a hammer, everything looks like a nail). 🔨 According to Ali, the Lakehouse was the paradigm for the week. I took all data points with a grain of salt (given it was a keynote), but I couldn’t help but walk away impressed.
Next, Reynold Xin talked about Spark and the community’s health regarding installs to deal with “Big Data" before Martin Grund discussed Spark Connect.
Fun fact: This started as an April Fool's joke because that much data processing power couldn’t possibly happen on a mobile device. But with a rejiggering, the OOM is the client, not the driver.
I walked away thinking this concept could be game-changing once made accessible to the general public.
Then Karthik Ramasamay came on to talk about Project Lightspeed. Quite frankly, I didn’t even know that Databricks did streaming, but apparently, they have been for a while. Anyway, fault tolerance and stateful streaming were major talking points here, but to be frank, I’m not sure I fully understood this (my streaming experience is a bit limited).
Side note: We saw a super cool shoutout to the Data Marketplace with Census customer YipitData being shown on the big screen for their data being used within the demo. That was super cool to see, especially as I’ve chatted with their team members through their use of Census.
One thing I really appreciated about this talk — and the overall vibe of the Data + AI summit — was how technical it was. Granted, this was only my third conference at the time. Still, it was significantly more pointed to the technical architecture that enabled all of the functionality and how engineers, ML engineers, analytics engineers, data scientists, and data analysts could leverage the technology. 💡
Throughout that day and the following days, I had the opportunity to listen to a couple more fascinating talks.
The first one was Xinli Shang, tech lead at Uber, talking about their data architecture — a super fascinating case of data storage at scale. Rather than store latitude and longitude at 8 decimal precision, they realized they could do so at 6 decimal places because the precision from 0.001 meters to 0.1 meters was not going to affect an Uber rider which led to significant savings.
A great takeaway for me here was to always understand the big picture and think through if it’s solving for the objective function in the way you want it to. In my Slack notes to myself, I wrote, “Wow, that was sick.” 🤙
Another talk I listened to was from Raphael Dayan, data director at PicPay. He spoke about the challenges that come with data sources significantly increasing as a result of sponsoring the biggest Brazilian Reality TV Show, Big Brother Brazil. There were interesting details about the exact implementation details, but the most important takeaways for me in this talk were:
- Build architectures thinking about business problems. Don’t isolate data teams.
- Fail fast, and be honest if something is not working. Always be willing and ready to rethink short, medium, and long-term goals as you monitor, learn and evolve
Along with a wild flamingo, there were countless sessions to help data professionals. Here are two more of the ones I enjoyed:
👉 Big Data In The Age Of Moneyball by Alexander Booth & Ryan Stoll, (Data team @ Texas Rangers Baseball Club). Major league baseball contracts are high stakes, so teams rely on data analytics to ensure their money is well spent. Learn how Alex and Ryan’s team do Moneyball!
👉 Operational Analytics: Expanding the Reach of Data in the Lakehouse Era by Boris Jabes (CEO @ Census). If you don’t fully grasp what reverse ETL is, or why it's important, check out this session! You’ll gain a conceptual understanding of how reverse ETL works with your data lake/data warehouse and applications, as well as how it expands the reach of data, and its impact on revenue.
What was also super cool during the talk was to see the shoutout to The Operational Analytics Club get some signups from people in the audience. 👏
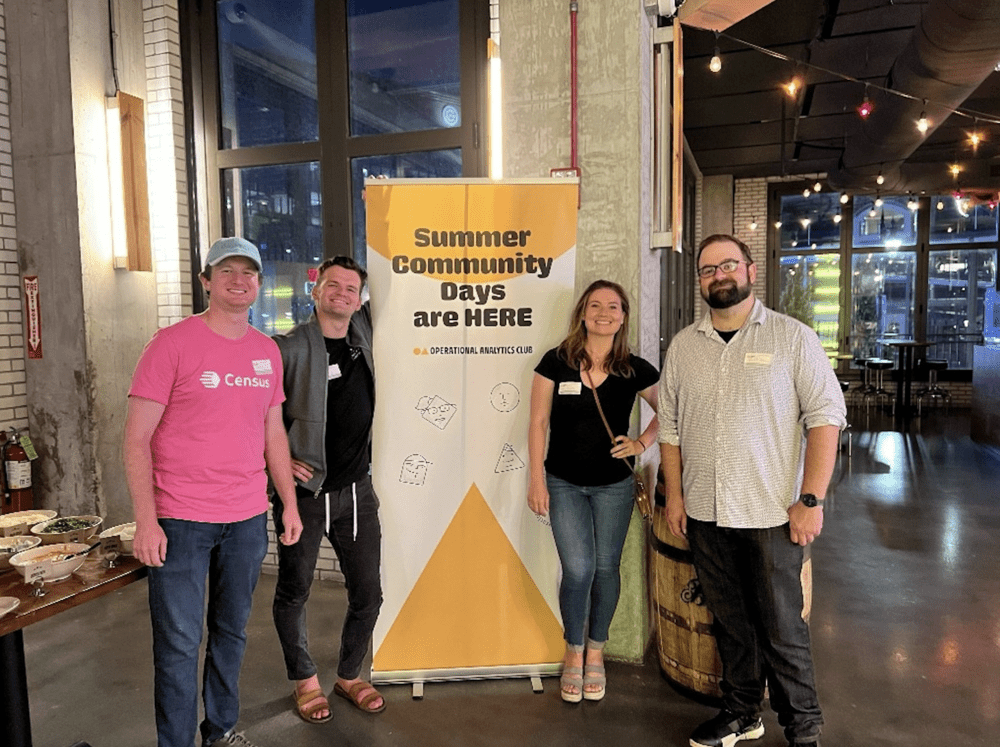
Summer Community Days (virtual with IRL happy hours around the US) 🍸
Summer Community Days Vol. 1 took flight at the end of July, and it was unquestionably my favorite event of the year! The conference was created by data practitioners, for data practitioners. It featured 30+ keynotes, workshops, and expert sessions, so whether you're an analyst, analytics engineer, data scientist, or something in between, you could find practical knowledge to apply to your data career today.
Both of us (Donny and Parker) were in Chicago together and got a chance to meet up with data folks at BigStar taco next to Wrigley Field to have some margaritas, tacos, and chat about data and life. 🌮 It was great. There were other happy hours taking place in LA, SF, Denver, and NY simultaneously, too!
During the virtual conference, here were some of our favorite talks:
👉 All of data engineering in 3 hours w/ Pete Fein (founder & data engineer @ Snakedev). Sure, it’s impossible to learn data engineering in 3 hours, but Pete Fein gives you a bird's eye view of how the data engineering sausage is made. He brings 20+ experience in data, and he walks you through data engineering in five parts:
- Overview of Data Engineering
- Overview of Data Stacks
- Data Platforms In Practice
- Overview of Data Architecture
- Audience Q&A
👉 Make events a first-class citizen with activity schema w/ Timo Dechau (founder & data engineer @ Deepskydata). Timo knows a thing or two about data. After all, he’s been modeling data since the star schema days in 2013! In this session, you’ll learn about activity schema, so you can start efficiently modeling your event data to put it to use.
Bonus: If you’d like to get a more hands-on tutorial of activity schemas, check out Brett Kobold’s session, Aggregatable Timelines: Activity Streams to Action.
👉 Lessons from the trenches: Advice for women early in their analytics career w/ Jessica Cherny (senior data analyst @ Fivetran). If you’re in the earlier years of your career (data or non-data), Jesica will teach you how to grow, achieve your long-term goals, and play offense rather than defense. 👊 It’s a great resource for anyone who’s serious about becoming an impactful data leader.
Hubspot Inbound in Boston 🌆
To wrap up the summer, we ventured over to Boston for Hubspot’s Inbound Conference. The conference hosted over 15,000 go-to-market professionals & 45+ speakers (Including POTUS 44, Barack Obama).
During the conference, I wanted to know how stakeholders felt about their data teams. I hunted down every go-to-market stakeholder I could find and asked them a series of questions:
🤔 On a scale of 1-10, how satisfied are you with your data team?
🤔 What’s the most common complaint to hear about your data team?
🤔 What’s something your data team recently accomplished that brings value to you?
🤔 How often do you communicate directly with your data team?
From their answers, I learned about how/where data teams can improve. Want to hear what they had to say?👂 You can view the findings in my blog, but the key takeaway was that the most common complaint from stakeholders is that they think data teams are “too slow.”
dbt Coalesce in New Orleans ⚜️
We also had the privilege of also going to dbt Coalesce, which was a spectacular time in New Orleans. You can read more about our favorite talks here.
What will next year bring? Stay tuned ✨
These were just a few of the awesome 2022 events we went to. Ultimately, bringing data folks together in such a fun environment made for a really great time and it was invigorating for the work that we do on a day-to-day basis. We also got to go to Data Council in Austin, BigData+AI in Toronto, and re:Invent in Las Vegas.
Needless to say, it was a jam-packed year and we’re super excited to see where 2023 takes us. 🚀
Want to hear about more data-focused events (and maybe even attend some yourself)? Join The Operational Analytics Club! 👐