


Existing tooling — intended to address data quality, freshness, and availability pain points — has failed to fix anything at scale on a fundamental level. This, in turn, has put companies between a rock and a hard place; they're forced to choose between trusting their data or being able to take quick action on it.
But if all these tools and the ever-expanding data industry haven’t solved the data freshness and democratization problem, what is the actual solution?
✨ Operational Analytics.
In this article, I will share my understanding of operational analytics and how one can power the growth of their product with a perceptive usage of analytics. Specifically, I'll cover:
- At what level founders can do analysis on their own, and common indications you need to hire a full-time analyst.
- How data engineering tools are applied in the case of B2B companies and why we reverse-ETL data to Amplitude.
- When dashboards are not enough
- How to empower stakeholders with the contextualized, critical data needed to propel the business forward.
A little background
From the business perspective, at the time of writing this article, SpatialChat:
- Is in the bucket of $1m - $10m ARR
- Has forty people spread across 12 countries
- Is a web-first product
- Has a hybrid — AKA product-led — sales model (i.e. self-service and inside sales team options)
- Has had three product pivots since launch in 2020
Plus, no one on our team had prior B2B experience!
Because of this, we had to start with the basics when ramping up, yielding a ton of learning opportunities and uncovering the "ideal flow" for a B2B startup.
B2B SaaS 101
It all starts with an idea. Based on previous experience, you've probably faced an underserved, urgent, and frequent problem. By completing a competitor's analysis and carefully articulating your target market, you'll mold the great idea you want to frame within the B2B SaaS business model. 👇
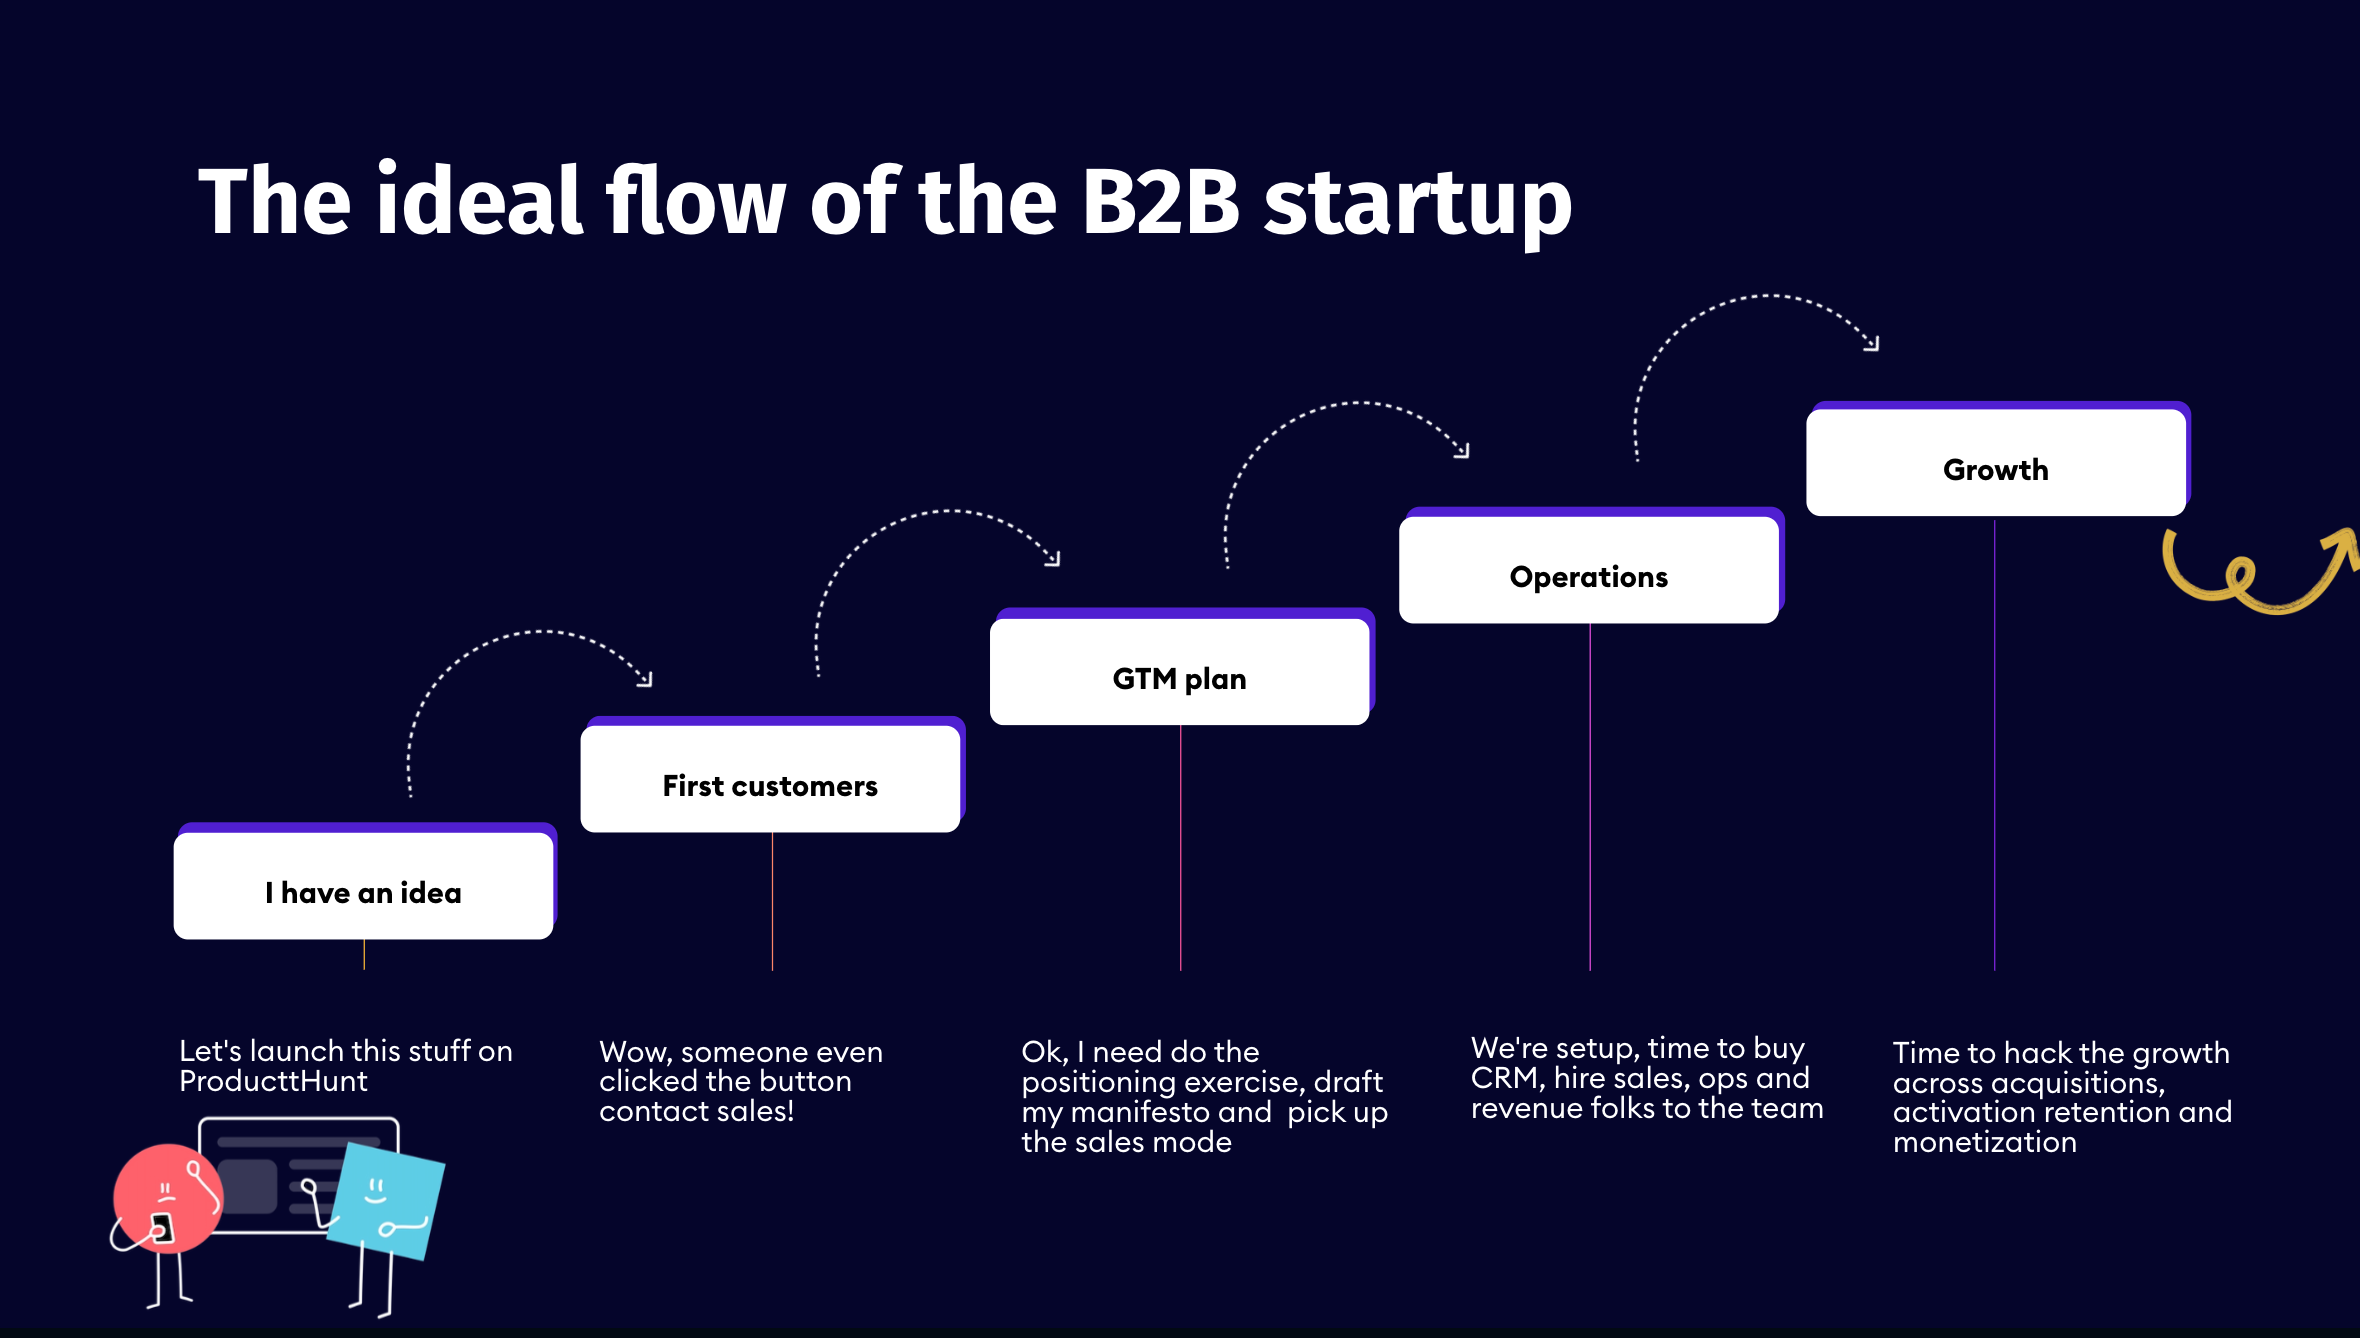
From there, you'll need to define the ideal customer profile (ICP) in detail and make some first founder-led sales. Start distilling the funding from the market and your ICP into running a successful Go-To-Market (GTM) machine. This includes an action plan for your positioning, messaging, and, most importantly, your strategic narrative.
After nailing product-market fit, set up the time to buy CRM products and carefully hire the first salespeople for your team. This helps you better understand whether you should do outbound, inbound, or partnerships and whether you will have a sales-driven or marketing-driven organization.
When you notice the business is going in a promising direction, fuel the growth across acquisitions, activation retention, and monetization.
After our two-year journey, I can confidently say that operational analytics should be the backbone of your GTM strategy. After all, the more stable your foundation, the faster you can innovate along the way. 💡
Our data stack for operational analytics
Operational analytics doesn't exist in silos. The GTM model defines growth, product, and functional performance (sales, support, marketing) metrics. I want to show you how our notion of using data (and our data stack) evolved over these two years.
Founding Stage 🆕
In the first six months, our focus was on finding our product-market fit.
Initially, the product was free-of-charge, but later we started testing the monetization hypothesis. The cost of insights is pretty low, and at this stage, it’s important to use qualitative data and be as close to your customers as possible. Here are some of the key ways you can explore customer needs and better navigate the product development stage:
- Talk to your customers through in-person interviews or manual onboarding.
- Conduct retention and churn analyses
- Validate your assumptions and try to mitigate risks
- Keep an eye on word of mouth about your product
When you have your first customers, start picking up the operating systems to manage the customer relationship. We began with Close CRM and Zendesk as a CRM and help desk, respectively. We tried to be as close to the customers as possible in the beginning, so it was mostly about founder-led sales (i.e the founders themselves had to reply to every ticket in Zendesk).
You can hypothetically measure a dozen things, but you’re so close to the details of your business that you can make pretty good decisions relying on non-quantitative data.
At this stage, we choose a few key value metrics representing the value the product creates for users and a few product metrics to see how users interact with the product.
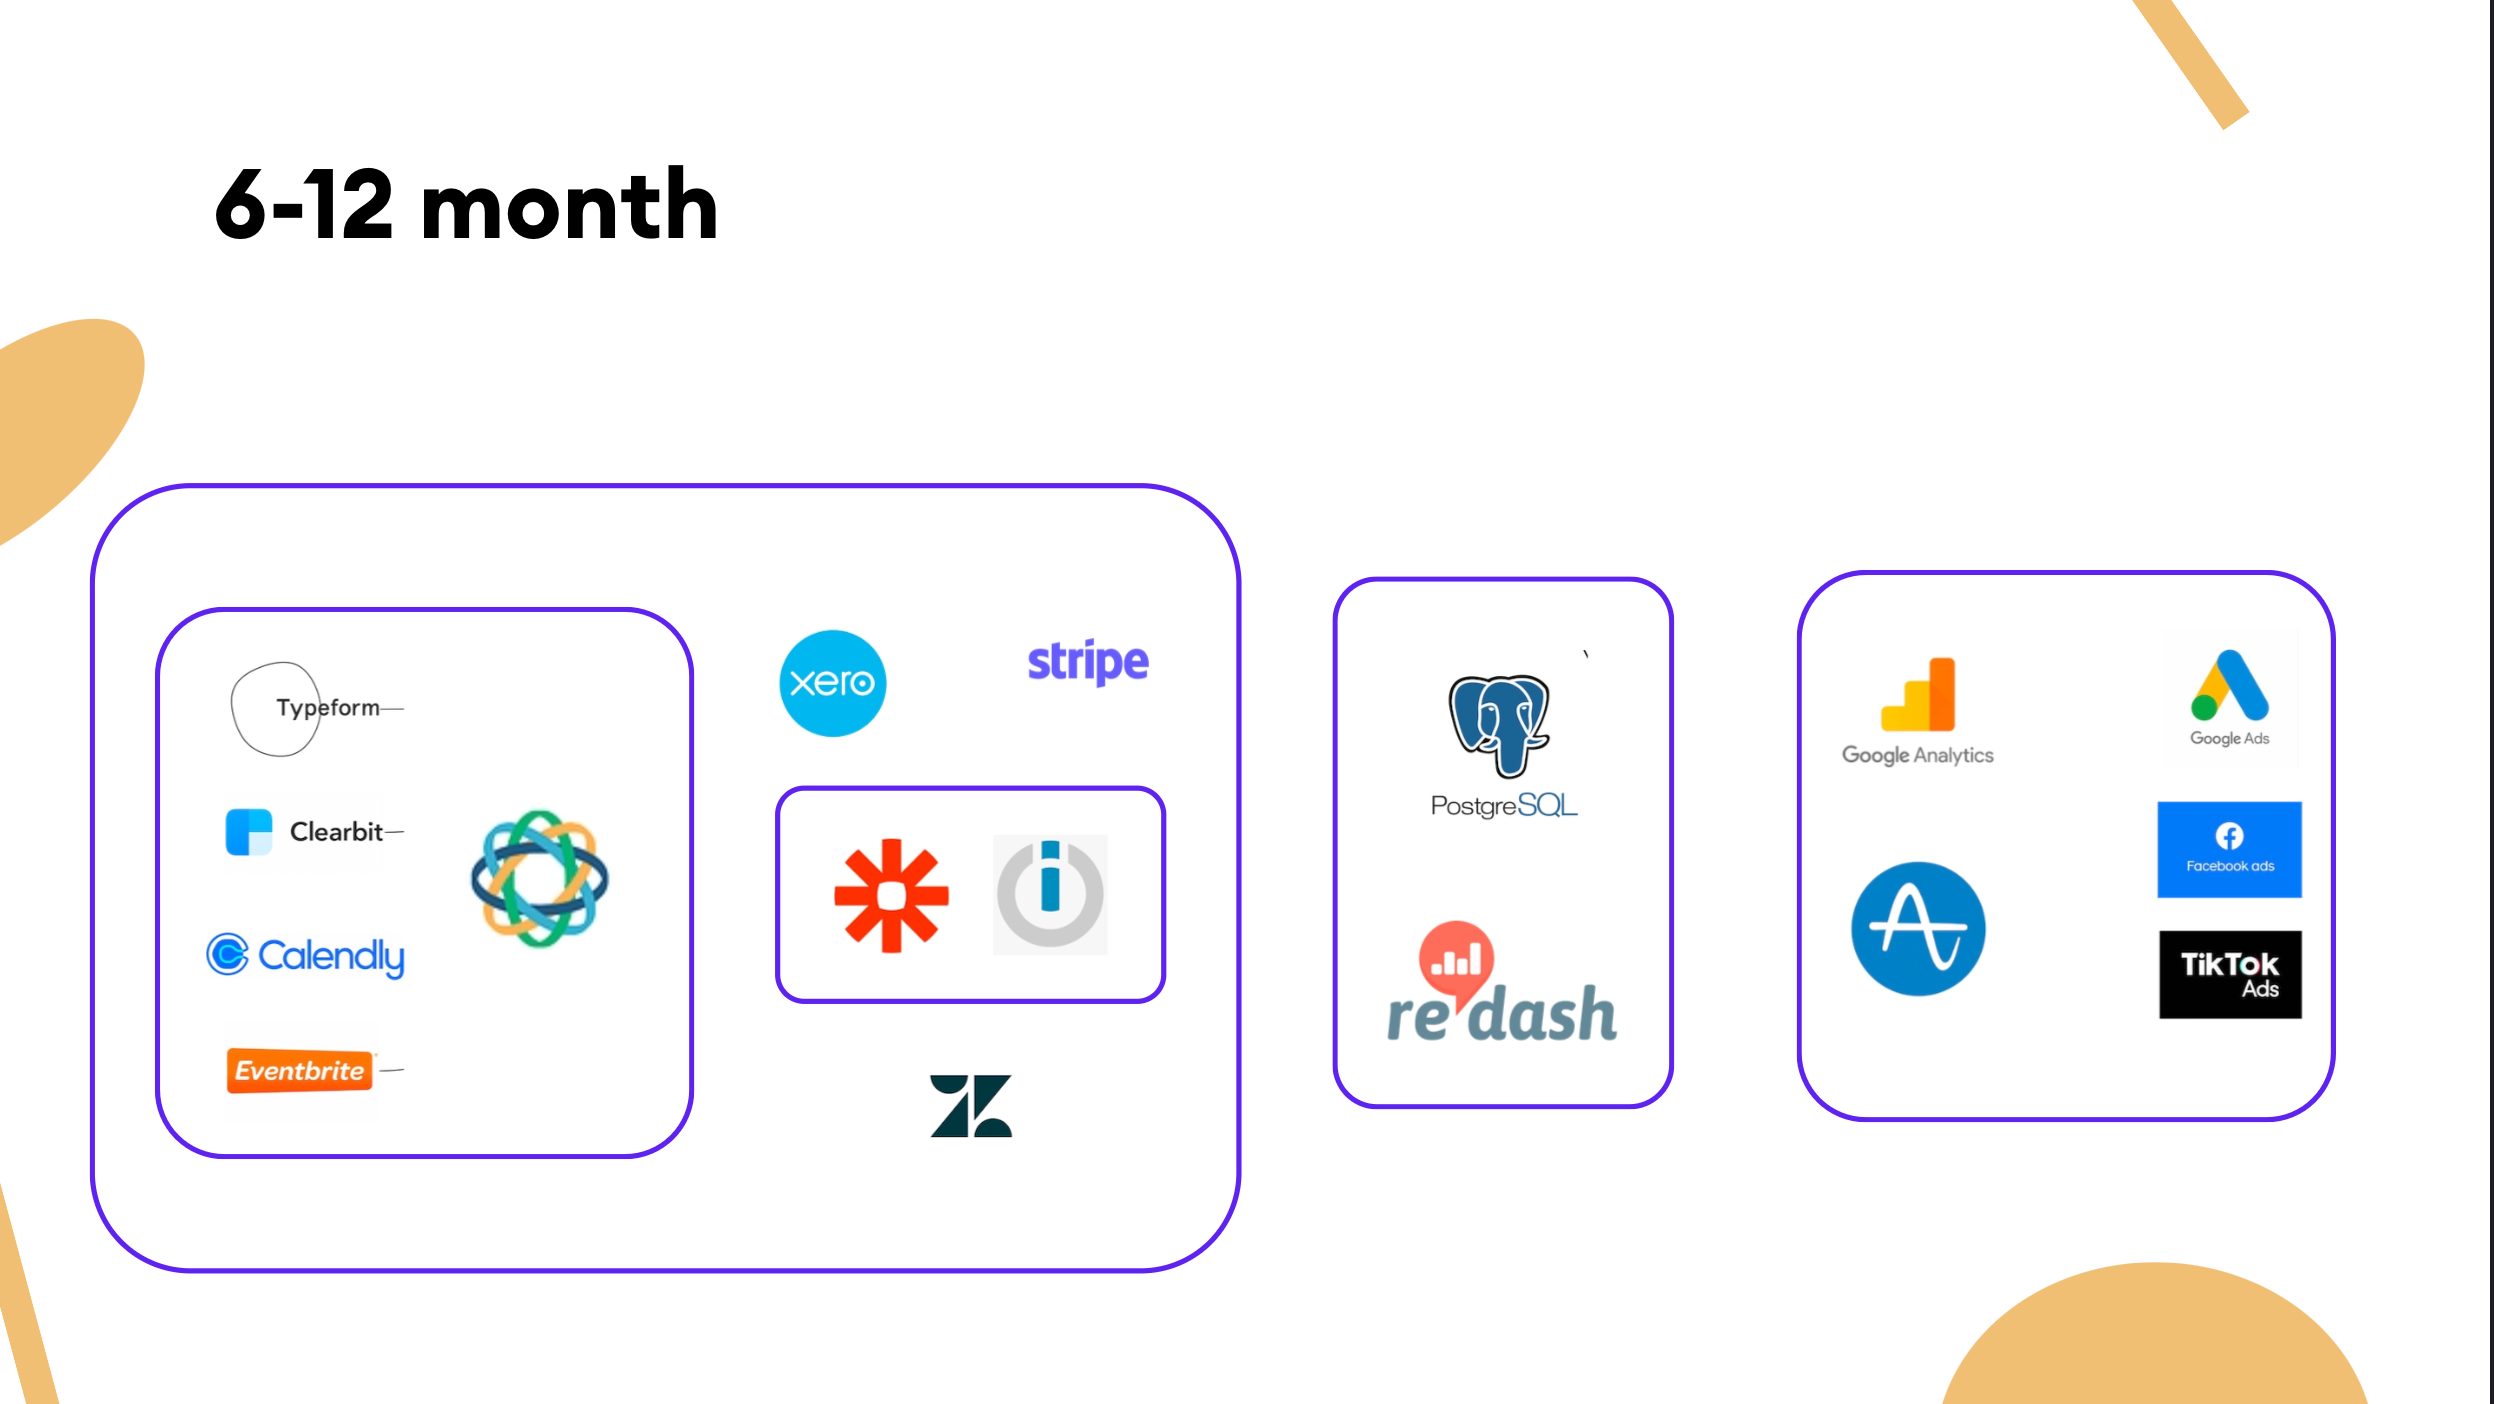
- For product analytics, we set up Amplitude as an event-based system. We kept it simple, actionable, and connected to our design system.
- There are a few templates on the web worth starting with. Don't follow the "log it all and figure it out later in the warehouse" methodology of logging telemetry. You're likely going to need to have more clever algorithms to isolate interesting signals from noise.
- We picked up Google Analytics for better visibility of our website's traffic source.
- We chose Postgres as a production database for our product, so to dig into detailed product analytics, we simply used a replica and queried data through self-hosted Redash. At this point, there were more important things to spend our limited funds on than getting fancy at picking up data warehouse solutions to run sophisticated queries.
Keep in mind that your metrics are a reflection of your strategy. They help answer questions like, "Is the strategy working?" There's no need to pick up the metric if you don't know how it's embedded in the strategy.
Early stage 🌱
Once the product had proved its mettle to B2B customers, we started building a business around it. We started drafting the first go-to-market (GTM) hypotheses and decided to start with a sales-led model.
As the company began to push more into enterprises, it evolved its pricing and packaging by introducing more specialized plans based on the needs of each customer archetype and use case. Here's some advice we came up with during this stage. 👇
Rely on build-it reporting. Save yourself time
- You can rely on the built-in reporting capabilities of your various SaaS products to run your business. Most CRMs have pre-built reporting tools; it's typically not great, but it can cover 90% of the cases.
- If you're not satisfied with reporting in your CRM, switch to another CRM. I would recommend against exporting the data to Excel or Google Sheets, digging into the data, and building sales reports there.
Note: Most help desk systems don’t have excellent reporting, so it's better to devise OKRs that you and your leaders can measure easily within the interface.
Well-defined workflow automation improves communication among internal teams.
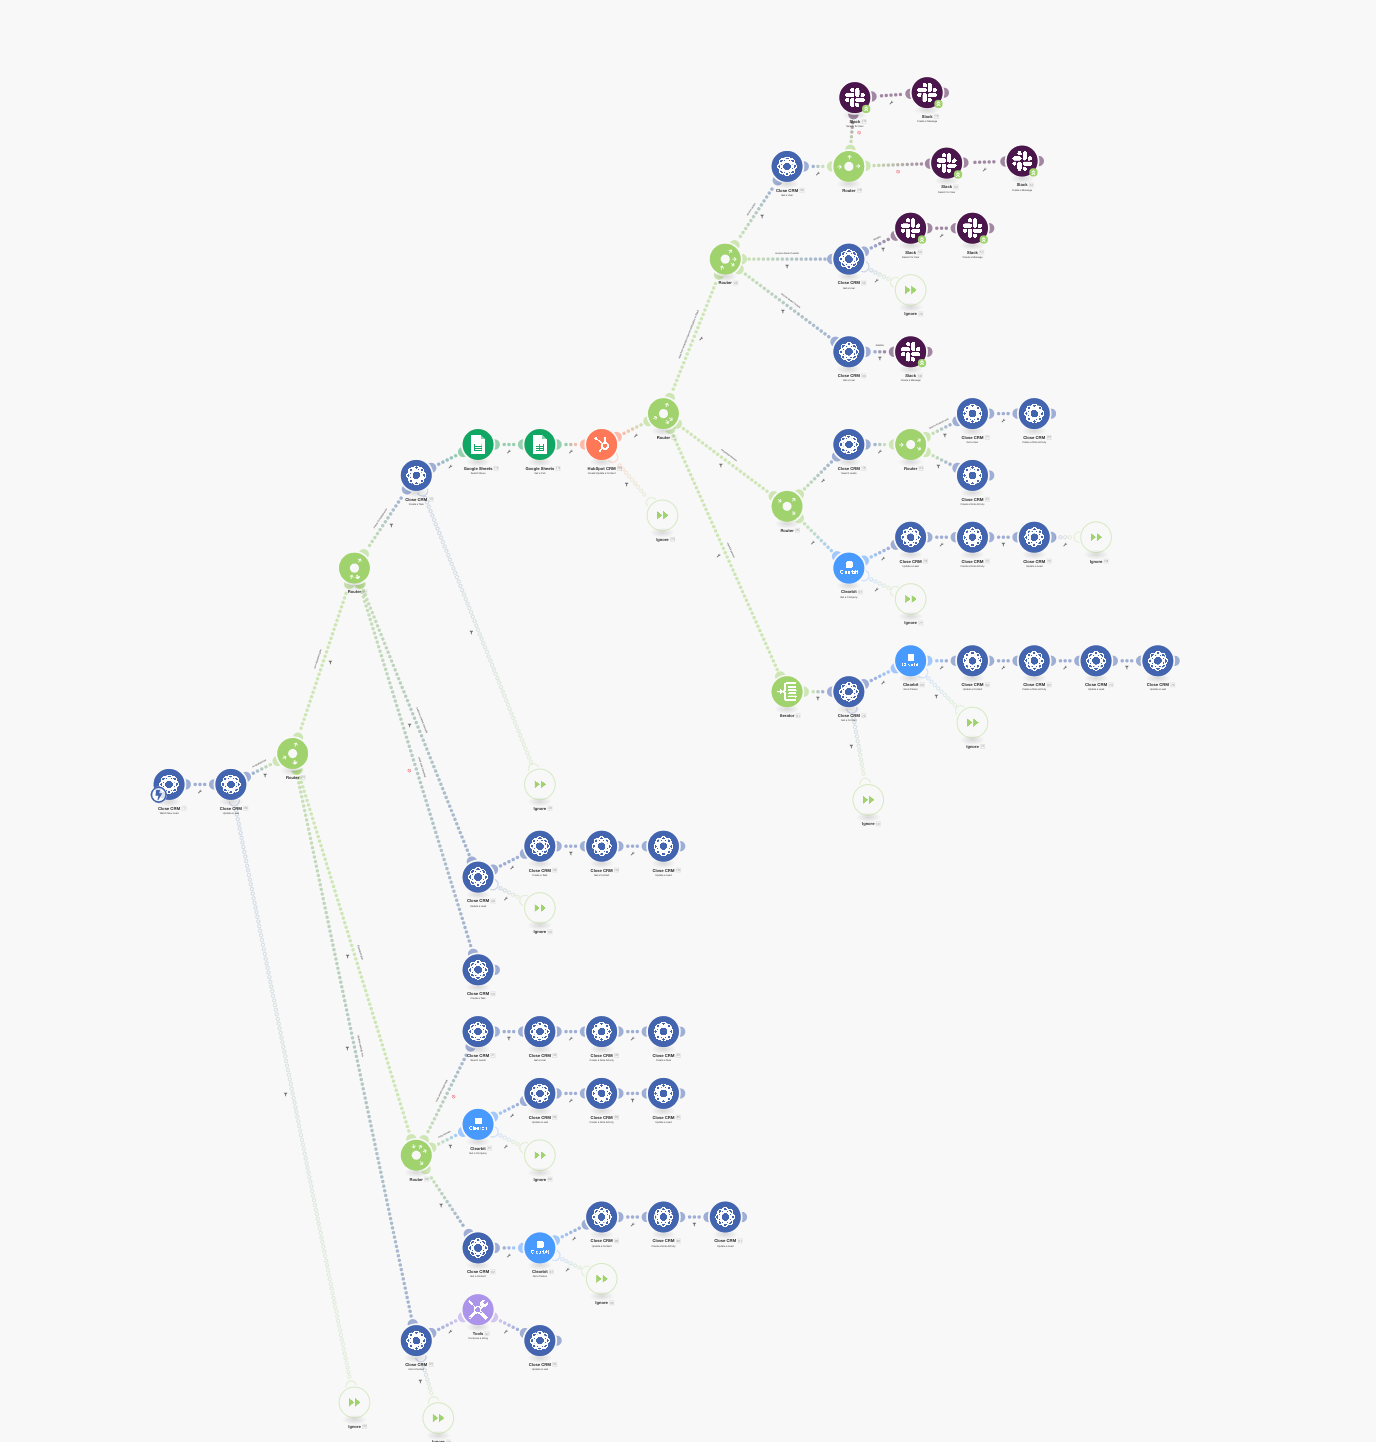
- It's vital to maintain good business operability, as well as proper communication among the internal teams. We temporarily solved the connection of all our back-office tools with workflow automation tools like Zapier, Integromat, and n8n to build the trigger-based data flows.
Note: I would not suggest staying for long with the no-code workflow tools. With the increasing complexity and lack of engineering practices, you risk sticking with a spaghetti code that makes it hard to maintain. 🍝
Frame your metrics wisely
At this stage, all our metrics were split into three portions:
- Product metrics answer questions about the product itself. They are used to understand how the changes made have affected user behavior. I recommend investing time in researching your product’s activation metric. Make sure you ask customer-facing employees what they think activation should be. Support reps, sales reps, and others spend all day talking to your users and trying to get them to find some value, so their insights are helpful for this early list.
- Growth metrics answer questions about the business built around the product. They help you to understand how the product acquires, activates, monetizes, and retains the account.
- Functional metrics help your teammates understand how well their team performs. Those metrics answer the question about sales pipeline coverage, the number of qualified leads, or the NPS from the customer care team.
Note: Usage creates revenue, but revenue does not create usage. As a result, the most critical metrics in creating growth are not your revenue metrics, so make sure all KPIs and everything needed structurally are covered by tracking. In this, I’d be a bit more holistic and proactive. Even if there are no people to look at it, at least cover the primary customer journey, funnels, etc.
Growing stage 📈
This stage was probably the most challenging. The team size remained almost the same, but the demand for sophisticated analytics across business functions increased dramatically.
During this time, we became a more hybrid sales organization (AKA a Product-led growth company). What we came up with at that point was that the data inputs were endless and were not uniformly collected, which means that everything lived in different data silos.
It’s pretty challenging to stitch all this data into a single view for all teams to consume. So, here's some advice we derived during this stage. 👇
Set up your data infrastructure
At this stage, we finally set up the data engineering infrastructure. As the product itself, we rely heavily on AWS, so open-source distribution is very much welcomed regarding tool evaluation.
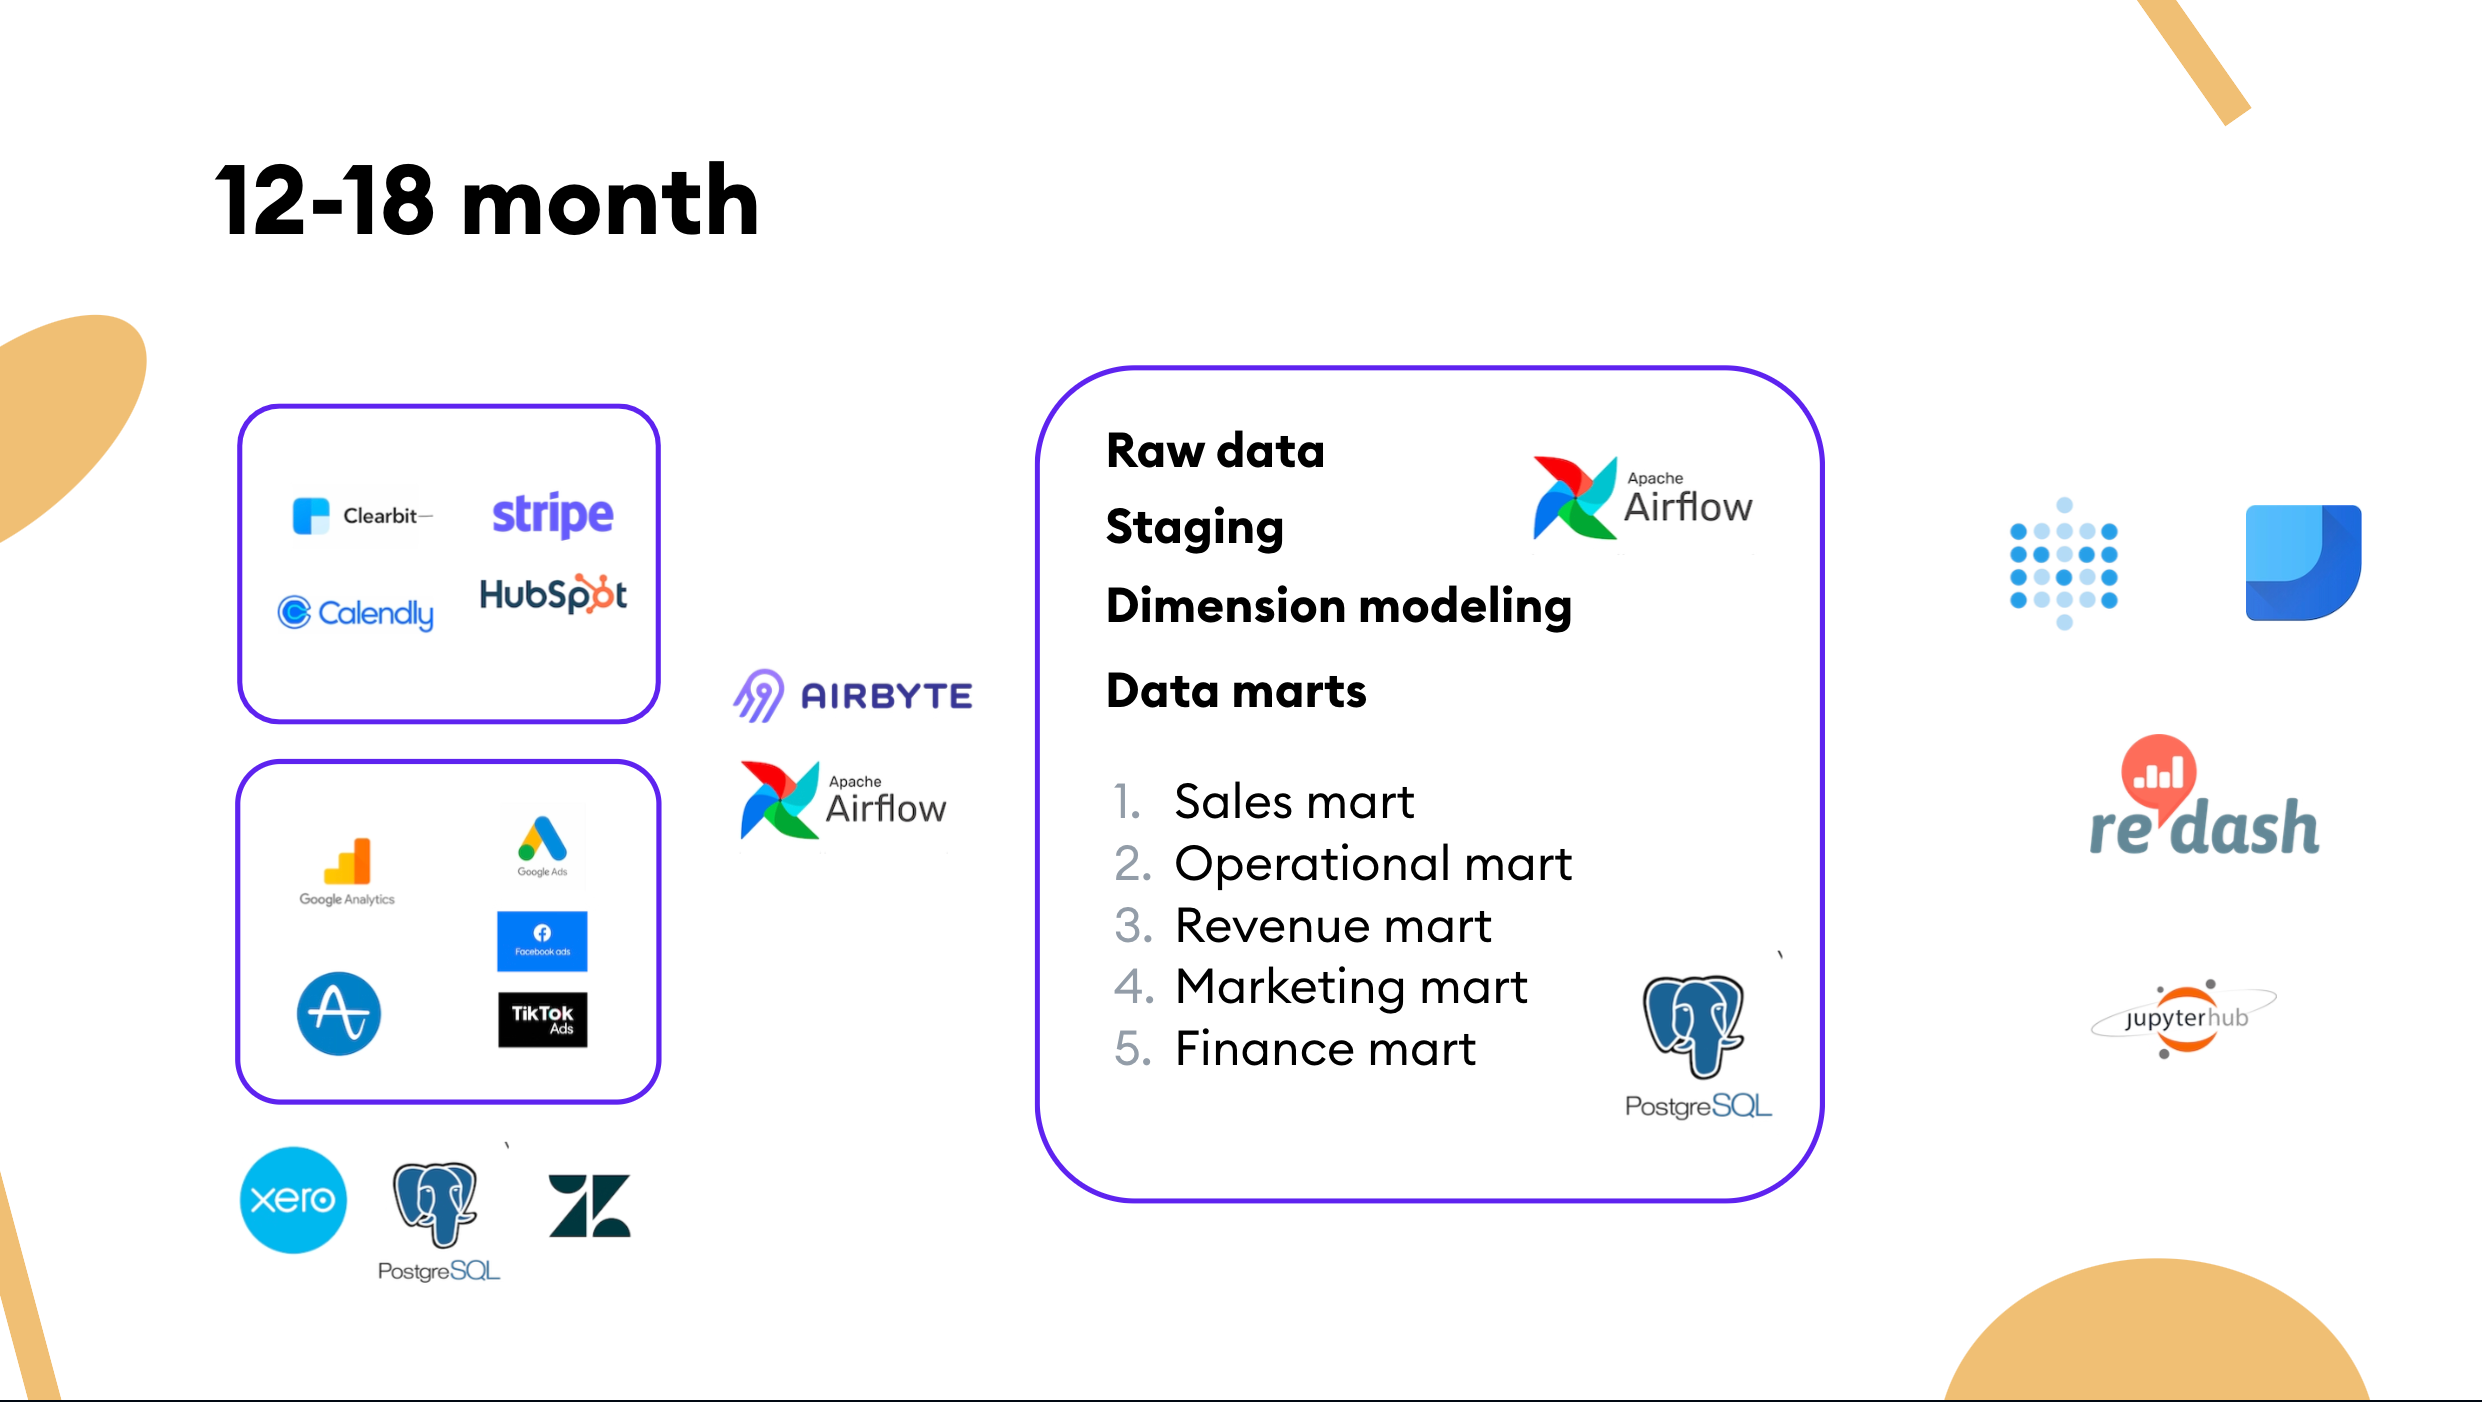
- For the data warehouse at the time, we chose self-hosted Postgres to get a better sense of data growth inside the organization.
- For ETL / ELT, we used Stitch and self-hosted Airbyte. Avoid bundling your ETL / ELT pipeline if you can. In our case, there were a couple of blind spots in the integration space, so we had to get our hands dirty and utilize Airflow and Python.
- Our BI has moved from Redash to another open-source tool, Metabase. We also did some client reporting and utilize Google Data Studio due to its convenient access-control management.
From then to now 🚀
That brings us from the last six months to now. Here's some advice from the last few months. 👇
As a startup, things are changing rapidly, so be sure your data stack is prepared.
- It's pretty standard to migrate from one operating system to another during your company's growth. At SpatialChat, we switched from Close CRM to Hubspot so we could transfer data consistently.
- Be sure that even when the product has a significant redesign, the event tracking can leverage the original event names and properties logic.
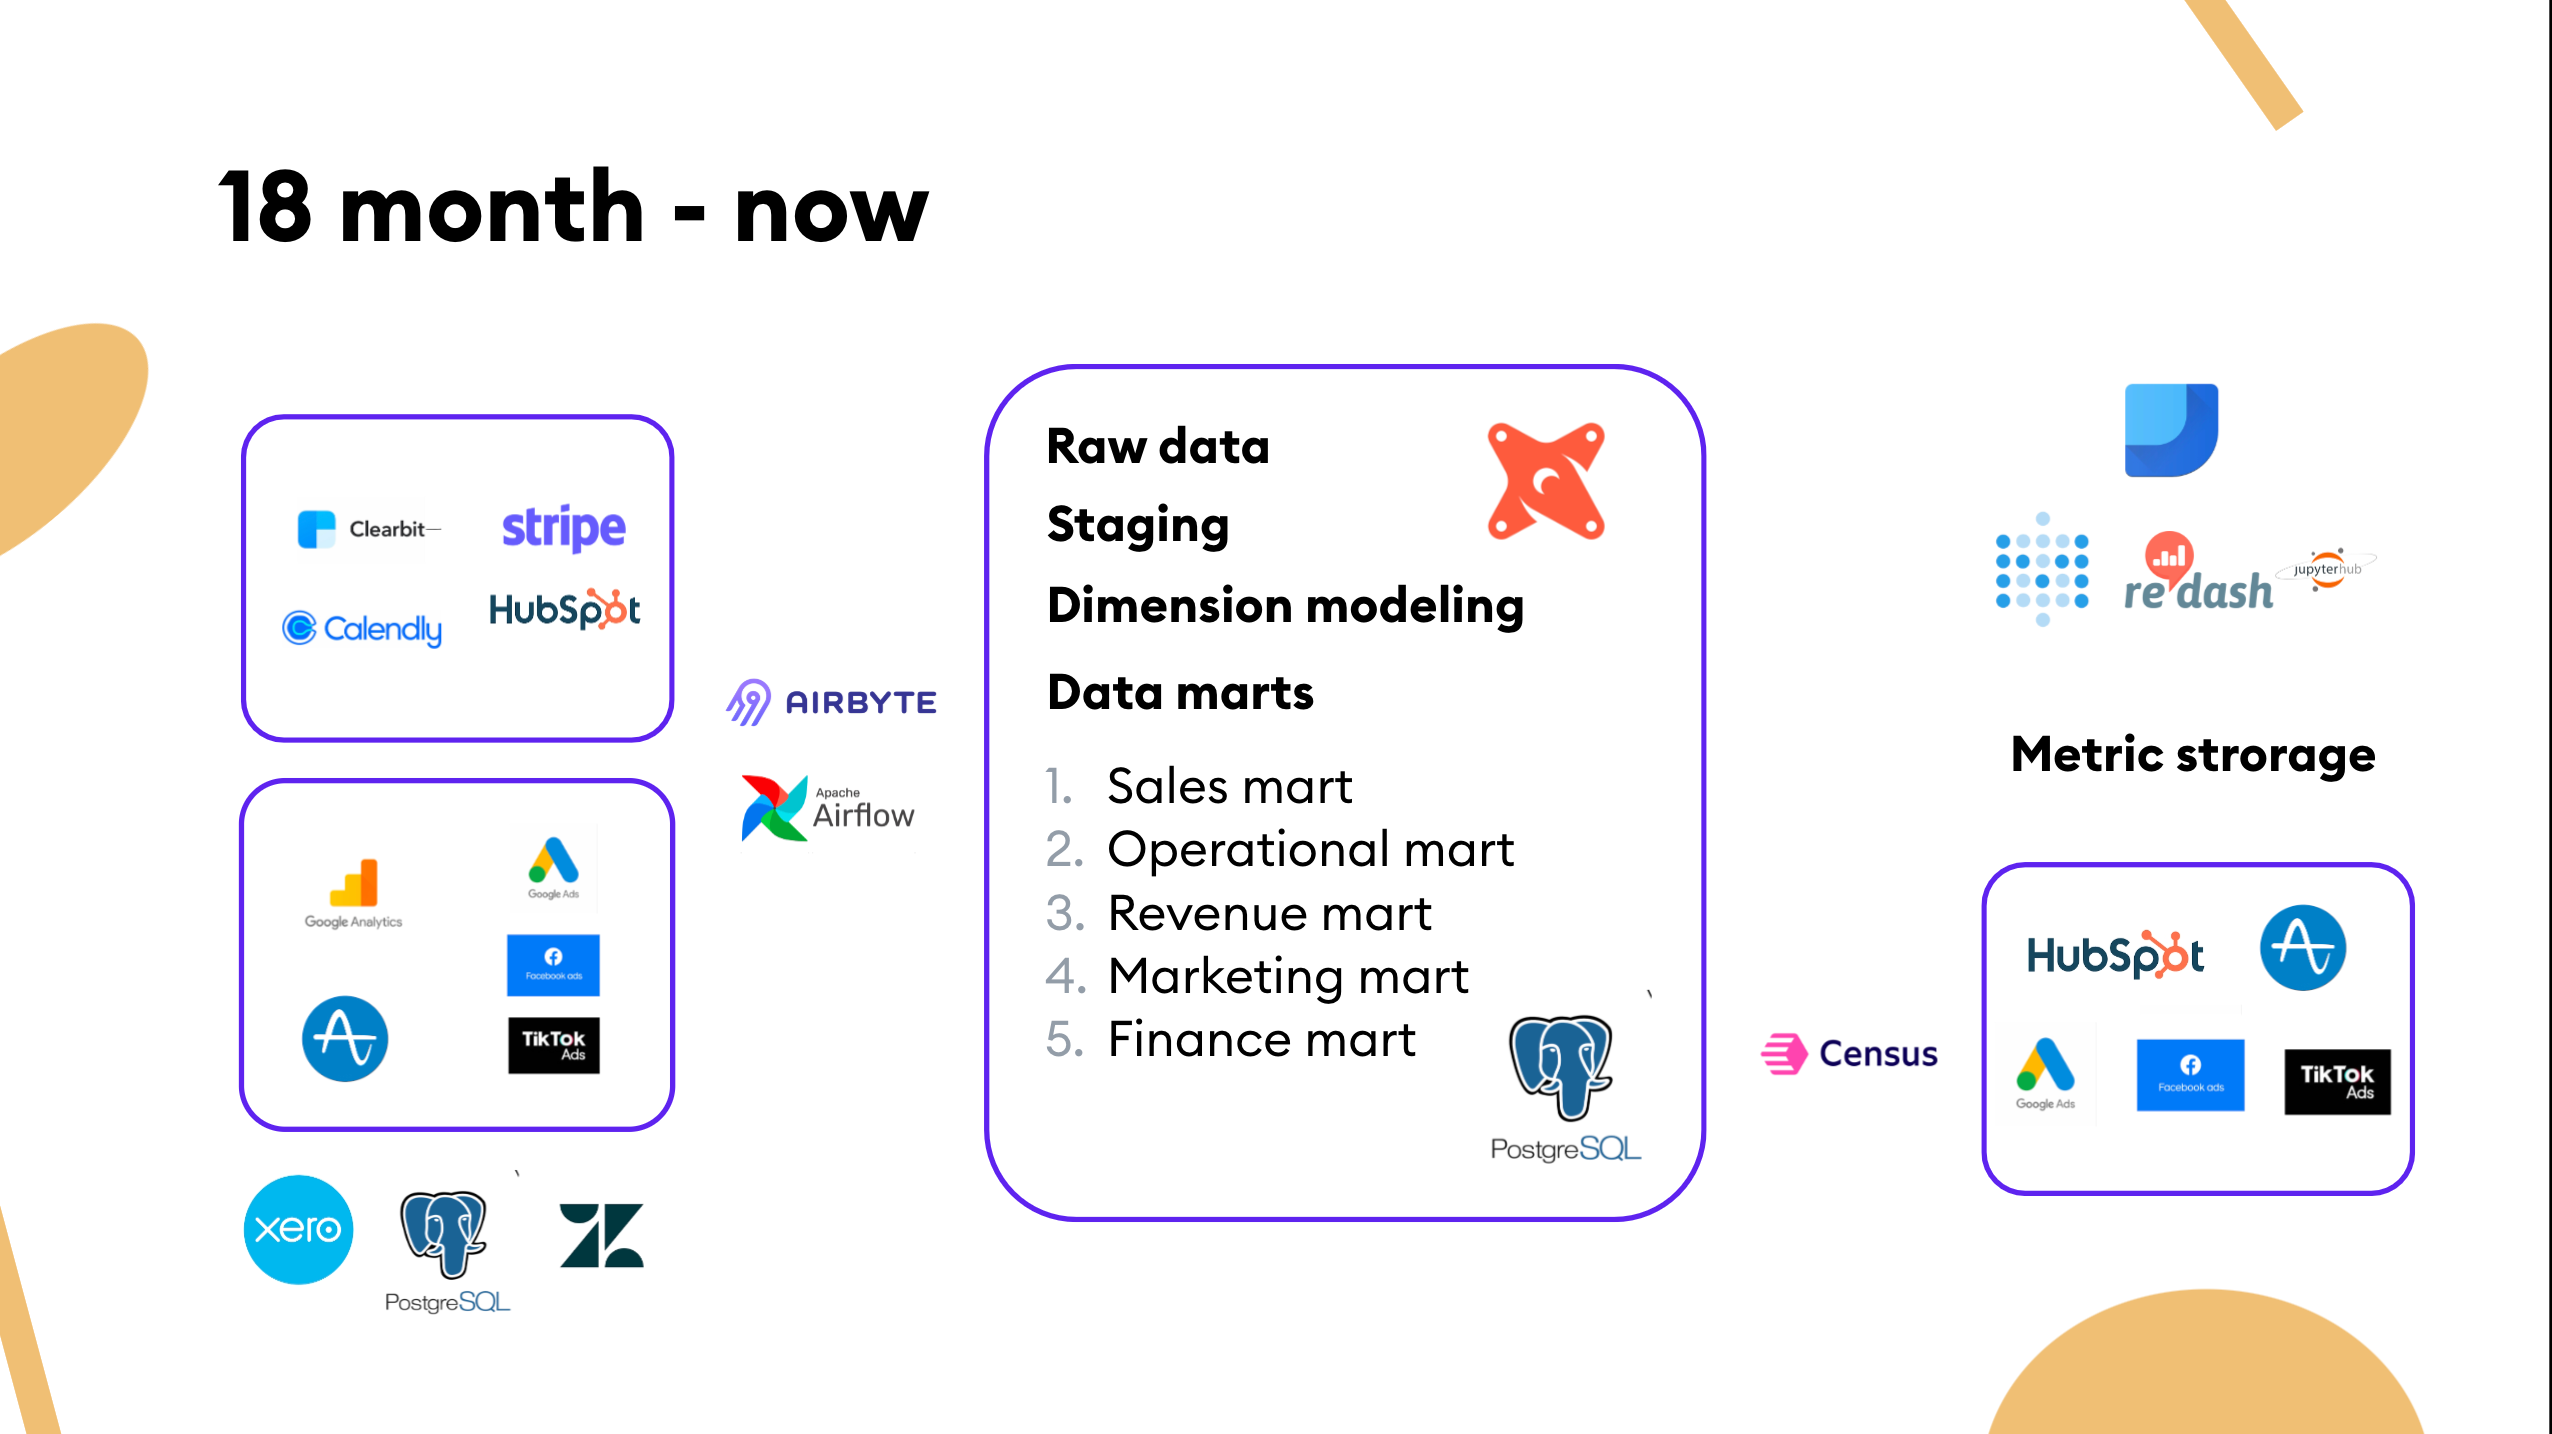
A dimensional data model from the beginning helps build the structure and quality for further analysis.
- Our data models serve as the underlying business logic for BI. We drafted five data marts: sales, operations, revenue, marketing, and finance. This distinction naturally reflected the number of stakeholders and their demand for better data visibility. The modeling part was version-controlled and ran in a transparent environment. We don't utilize any external tool for that currently, but we'll consider using dbt in the future.
- It's easy to get data messed up at this point, so invest in data quality. 💰 Defining metrics is an exact endeavor, and semantic layers should allow us to focus on business complexity.
Note: It's worth investing in metric storage from the very beginning — which is both a tooling and a process problem — so everyone in the company should have access to the logic behind the calculations.
Be mindful when growing your analytical force
- Honestly, I don't feel like there is any other option other than initially hiring a full-stack data person. Small data teams must be creative, take on multiple roles, and focus on quick results.
- I'd suggest investing more in sharing and transferring knowledge across the company at the beginning rather than hiring aggressively. Save some time to clear the technical debt at least once every two cycles.
Now that I've covered our journey and the knowledge gained from it, I want to highlight some general things this journey taught us about the modern data experience.
Data Activation
Before building SpatialChat, I worked as a data scientist and quantitative analyst in a business where data is embedded in the day-to-day process. At SpatialChat, we don't use machine learning in the product, so the data feedback loops are less evident. When we scratched the surface of powering the flywheel to run a product-led growth motion, we picked up the initial approach of driving “visibility.”
Many teams view the goal of data initiatives as tracking metrics though the real goal is to analyze those metrics, but those two things are very different. The latter is how we make information actionable.
Dashboards are not enough to make data actionable by business users. Every operation system can be transformed to the micro-BI using reverse ETL.
Teams will always be constrained by time and resources in a world of quarterly OKRs and fast-moving competitive markets. Don't force people to look into the dashboards and write SQL queries; instead, contextualize their experience with data.
Contextualizing the data to build productized experiences for data consumers
The rapid adoption of cloud data warehouses has given rise to Reverse ETL—a new paradigm in data integration that enables you to activate data already present in the data warehouse by syncing it to third-party tools. At SpatialChat, we picked up Census.
PLG companies can leverage their existing bottoms-up tailwinds to drive a top-down sales pipeline. We pushed the current data to Hubspot to enrich the work process for the sales team.
Why? Having data in Hubspot gives sales reps a better understanding of the conversations they need to have with prospective customers and which accounts are most ready for an enterprise sale. For the operational folks, it helps to spend less time on integration work.
From dashboards to activation
Increased capabilities of the data function unlock deeper accountability as specific teams can now be responsible for input metrics that lead to better scoring instead of a generalized, shared responsibility of output metrics.
But when you pipe data into downstream applications, remember that it's easy to overwhelm your team. A better approach is to think about the end goal.
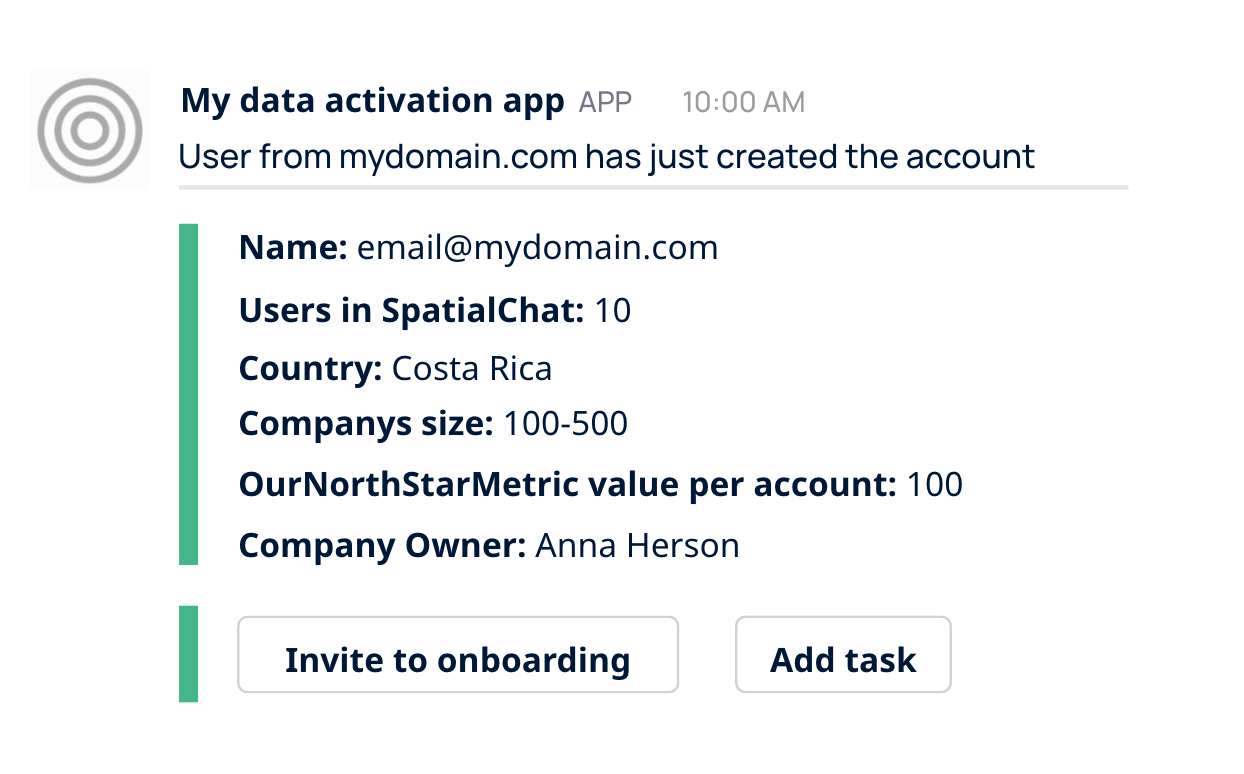
Notifications enable a healthy combination of tech-touch and high-touch communications. When it comes to B2B business, there's always a conflict between the means of communication.
In the end, you need to help your teammates reach their goals, so we came up with a convenient notification engine in Slack. In that case, the account manager can decide whether they need to reach out to the customer, add the task for themselves, or ask them to review the product on G2.
That way, companies with limited data engineering resources can derive significant value from integrated solutions that enable product and growth teams to move fast without relying on data teams.
If you take anything from all of this, remember:
- Data needs to be seen as a strategic lever for GTM strategy.
- Value process over tooling. For instance, PostgreSQL is as fine as DWH for early-stage organizations.
- Prioritize the DWH-native operation systems for your data stack, but keep in mind not everyone in your team is proficient in SQL
- Business problems are extraordinarily complicated, and analytical recommendations are mostly educated guesses.
- At every stage of the company, analysts should think about maximizing the value of observable data.
Thanks to my colleague Artem Merkulov for designing the whole system from scratch and tech editing this post.
👉 If you want to connect with Danny, add him on LinkedIn or Twitter.
☀️ Catch Danny's full talk from Summer Community Days here.
😎 Then, head on over to the Operational Analytics Club to share your thoughts with Danny and others in the community!