


In the high seas of SaaS competition, customer data is the compass that leads you toward the buried treasure; it gives you a clear sense of direction and keeps you from sailing your product straight into a cliff. ⛵
This is particularly important when it comes to product-led growth (PLG), where you take in customer feedback and make iterative improvements, turning your product into the main driver of acquisition, engagement, and retention.
In this article, we’ll be looking at not only how you can enable product-led growth by leveraging customer data, but how the two absolutely need each other to drive success. 🚀
Use customer data to drive better product decisions
Think of PLG as a conversation. Your customers and your product are always interacting with each other, and, within those interactions, your customers are revealing how you can serve them better.
But, like any real conversation, how can you respond appropriately if you can’t hear what they’re saying? How can you start taking steps towards improving their experiences? 🤔
The thing is, your customers are always telling you what their needs are and what they find value in. You just have to be able to capture that information. In other words, you need customer data insights to make decisions that will meaningfully improve the customer experience.
Using customer data to understand users
Too many people think understanding users is a top-down experience. They break users down into broad segments based on job title, age, and other demographic factors, neglecting the most important factor: The users themselves.
But seeing the way your users interact with your product can be enlightening. So, understanding users actually has to be a bottom-up exercise where you start with behavioral data.
For example, you might see that the majority of new users drop off at the onboarding stage, never to return, which could indicate that the onboarding flow is either:
- Too overwhelming
- Not clear enough
To prevent this drop-off, you could experiment with simplifying your product tour or splitting one long tour into a few smaller ones to show the most relevant messages at the right time.
Once you have the customer data and know how they are behaving within your product, understanding their needs becomes much simpler.
Building out the product your users really need
Product feedback is crucial to creating optimal customer experiences. It tells you where your users have problems or where their needs aren’t met, highlighting areas for improvement that you may not have been aware of. Once these issues are brought to the forefront, you can relay them to the product team to address.
If you notice that your freemium users are churning without ever trying out advanced features, you might need to find a better way of nudging users to realize your value more quickly. In other words, you need to get them to their ‘aha!’ moment. 💡
Using in-product engagement tactics, you can create product tours that guide users and educate them on how to best use the product. Or you can have tips highlighting key values and unblocking users whenever they get stuck. One thing is for sure: Effective in-app prompts lead users to the ‘aha!’ moment more quickly.
Personalizing the customer journey
Another opportunity you have is personalizing customer interactions within the product. To achieve PLG, your product needs to be able to serve up the right kind of experiences exactly when and where your users need it.
Letting the product sell itself
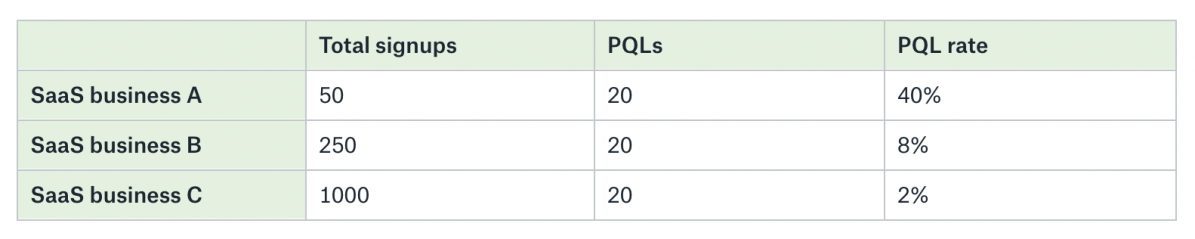
Once you know what the customer needs and you've built features that your users find value in, it's time for the product to essentially sell itself. Cue Product Qualified Leads (PQLs).
Product qualified leads are those who have already found value in your product by using it, most likely through a freemium model or a free trial.
While the PQL is a metric that shows how your product is doing as a source of lead generation, it can also reveal quite a few insights into your PLG strategy.
Another important PQL metric is the PQL conversion rate: The rate of new paid accounts out of all PQLs. So, if there are 35 new paid accounts out of 100 PQLs, the PQL conversion rate is 35%.
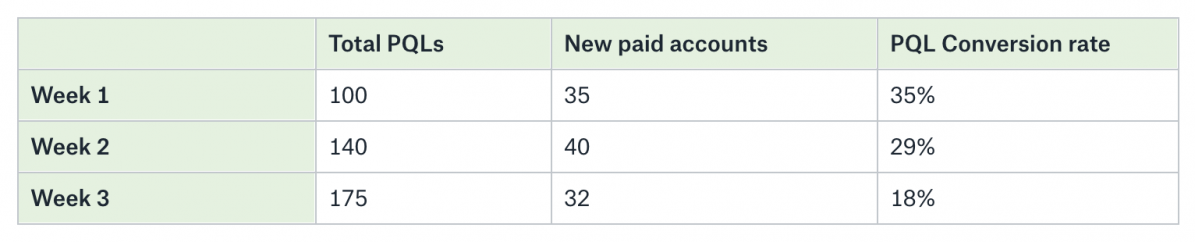
When the PQL conversion rate is high, things are going great. In fact, it might mean you need to raise your prices! 🤑 But when this rate is low, either the upgrade flow needs to be improved, or you need to keep improving your product until it delivers enough value to justify paying for it.
✨ Curious about how others have used their customer data to inform their product decisions? Steal use cases from some of the best PLG companies to bolster your own product-led growth.
Finding opportunities within the product through customer data
What's more is that product-qualified leads can be identified among your paying customers, too. Having a good view of which customers are getting the most value helps you spot upselling or cross-selling opportunities that you might have missed.
Track user behavior in-product with a single source of truth
Customer data and PLG are closely intertwined, so to gain insights into customer behavior in-product, you need to have a 360° view of what’s going on with your users.
Luckily, the modern tech stack for a SaaS product now includes a wide range of tools that can capture data from customer experiences and actions. The problem is extracting all the data and putting it into a single place where you can actually transform it, analyze it, use it to make evidence-based decisions, and turn that customer data into actionable insights.
Create a single source of truth
Customer data can be produced and collected by a myriad of sources which can create critical inefficiencies and become a problem if team members start to look at different silos of information.
This is why you need to have a single source of customer information that your entire team across all departments can rely on.
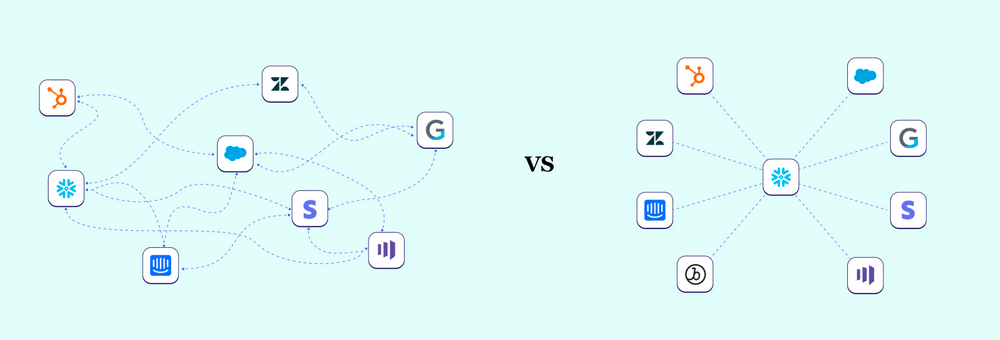
Of course, manually transferring your data to a central hub is a real-life nightmare. Fortunately, ETL services like Fivetran can centralize your data by connecting to hundreds of tools and pulling it into a data warehouse such as Snowflake or Redshift.
Get the data to every team
Once you have unified customer data, it's time to get that data to your teams so they can start leveraging it to their advantage.
- Sales teams can spot ideal customers for conversion
- Marketing teams can personalize user engagement
- Product teams can develop features based on user feedback
- Customer Success teams can proactively prevent churn
And this is where the final piece of your data stack comes in. A reverse ETL tool like Census can quickly sync your customer data to all of your business tools from your data warehouse.
How to measure customer success
Now that you have a single source of truth, it’s time to measure success.
Start with a goal
Data is essentially an answer to a question. 🙋 If you don't know what question you're trying to solve, you won't know the purpose behind the data you're looking at. There is no ‘why.’
But by identifying a fundamental problem or a challenge, you focus your data collection and analysis, allowing you to determine what metrics you have to track.
Keep the metric consistent across teams
You need to make sure that all teams across your organization have their eyes on the same metric. For example, the meaning of “active users” can vary between Marketing and Product teams. These gaps can create inefficiencies across the organization, but you can close them by standardizing your metrics in your single source of truth.
Aligning your metrics with PLG strategy
As Bruce Lee said: "Knowing is not enough; we must apply." So how do you apply these insights to your PLG strategy?
Well, first, you have to know where your users are having trouble with the product. See where the drop-offs are and where people are getting frustrated, then look at what parts of the customer journey are just not working. Your core metrics will reveal the truth on all of these questions, which will guide you to iterate on those areas.
Enhancing the product experience
When you have your customer data and the data infrastructure to operationalize those insights in the hands of business users, that's when you can really start to take huge strides in improving the product experience for your users. 🏃
Experimentation is key when it comes to successfully iterating your product. By adding a digital adoption platform (DAP), like Chameleon, as an additional layer for your in-product experiments, you can save time and cut costs while improving the overall customer experience.
You can also enhance your PLG strategy by implementing customer feedback mechanisms right inside your product or creating self-serve features, allowing your teams to focus on more mission-critical areas.
Implement PLG with confidence
If PLG is the ship you're building to sail, then customer data is the ramp it will launch off. Executing PLG requires evidence-based decisions based on product analytics, so you need a solid customer data management stack that feeds all that valuable information to your business teams.
When you have precise, actionable insights from customer data, every team at your organization can have confidence that they’re making the right decisions and taking the right actions to achieve success.
Want to start accessing your customer data? At Census, we can help you sync your critical customer data from your warehouse to your business tools, so you can start operationalizing your insights.
👉 Book a demo, and we’ll teach you how you can leverage your existing product and customer data to enable product-led growth.